
Estimated reading time: 7 minutes
I can’t be in the same room with a box of Cinnamon Toast Crunch. I’ll devour an entire box in one sitting. This wasn’t always the case. I hadn’t had a bowl of cereal since childhood. . . until the 2020 Lockdown. That period changed everyone’s viewing/dieting habits. I’d binge-watch ridiculous Netflix shows while eating Cinnamon Toast Crunch right out the box (yes, it’s so delicious that you can eat like popcorn). But to bring out all its cinnamon-y goodness, you MUST add milk. Mmm, the combination detonates a sweetness explosion with every bite, and don’t even get me started on that leftover milk! I find it similar to the CPU% metric in Performance Monitoring. Everyone appreciates the value of tracking CPU% usage yet few understand how adding Instructions-Per-Cycle (IPC) tracking brings out its full flavor. We’ll discuss the importance of monitoring IPC, and then consider a real-world example of its utility.
Table of contents
What is CPU% Usage?
Ask technologists what CPU% measures and many will insist it tracks the amount of “work” a CPU performs over a given interval. If monitoring alerts that CPU% reached 75, they’ll conclude it was busy executing instructions 75% of the time. However, that is a common misconception.
What CPU% actually measures is the amount of time the CPU wasn’t running an idle thread. When Linux boots, it creates an idle thread for each core on the system. When no user or kernel thread is scheduled to run, the idle thread for that core will run instead. For those of you who’ve ever tinkered with kernel boot parameters, settings like idle=poll might look familiar. These settings affect how the idle thread behaves when scheduled. The kernel keeps tabs of time devoted to the idle thread, and from there derives CPU% usage (100 – idle%).
“Umm. . . so? Isn’t that the same as measuring its busy time?” Actually, no, because a running thread is not necessarily making forward progress the entire time it runs. If it stalls waiting on memory, the kernel still reports it as non-idle CPU% usage for as long as it is “running.” And guess what? The CPU depends on memory for both data *and* instructions. This means that an instruction could already be in the CPU pipeline but stalled waiting on memory for its operands. Or the CPU could stall waiting on memory to feed the instruction into the pipeline to begin with. In either case, as long as it is “running” on the CPU, it is counted towards CPU%.
It’s like that friend who laments that his dad bod is immune to exercise despite his 90min-a-day, 4x-a-week routine. But when you join him one afternoon, you discover that his “90min routine” includes ridiculously long rest periods during which he chats up women or answers phone calls. Sure, the time between his entry and exit from the gym totals 90mins, but was it really a 90min “workout”?
Now wouldn’t it make more sense if CPU% tracked the number of executed instructions vs. the max number of instructions possible within a given time period? Good question! Let’s talk about IPC.
What is IPC?
Modern pipelined, superscalar CPUs are capable of executing multiple instructions within a single clock cycle, referred to as IPC. A majority of Intel/AMD CPUs reach a max throughput of 4.0 IPC (although the latest push 5 or 6). Therefore, tracking the percentage of the CPU’s max IPC our code utilizes will give us better insight than CPU% alone. If the CPU executes 2 instructions of your app every cycle, you have an IPC of 2.0. You’re utilizing only 50% of the CPU’s full capacity, even if CPU% usage clocks in at 75 or 90.
CPU% is still a very useful metric for tracking and trending purposes. It’s why this metric is one of the preconfigured defaults for every monitoring tool in existence. But to bring out its full flavor, you gotta pair it with IPC. After all, it’s the milk to the bowl of Cinnamon Toast Crunch that is CPU% usage.
But tellin’ ain’t sellin’. So let’s look at a real world example of how this has helped me in my career.
The Mysterious Case of Slow CLX vs Fast SKX
One morning, the Business alerted our SREs that one of our service deployments was generating less revenue than another, identical service. What made it odd was that the more profitable service was running on the older, slower-clocked Skylake (SKX) server! What’s more, this dual-socket SKX machine ran a second, unrelated service while the newer, faster-clocked Cascade Lake (CLX) only ran the one service in question. How could this more heavily-loaded SKX perform better than the relatively lightly-loaded CLX???
Our SREs showed me the nearly identical per-core CPU% usage graphs (TICK stack) between both machines. At this point, I scrolled down the same page to show them our recently added “IPC” graph (it must be explicitly enabled in telegraf.conf). Here’s how those graphs looked on the SKX machine:
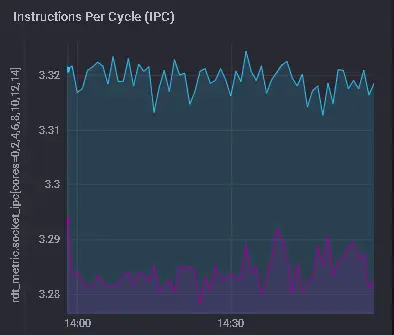
The two colors represent the two separate services running on the two distinct CPU sockets. Look how closely to the max of 4.0 IPC that both services execute – ~3.3 IPC for each. Now, let’s look at the same graph for the CLX machine, which is only running one service on one of its sockets:
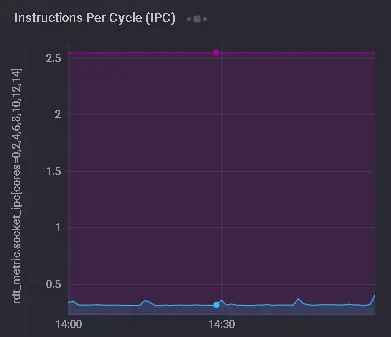
Whoa! The one service on this host only achieves an IPC of 2.5 – that’s a huge difference from the SKX! Time to hop onto each machine and see what’s going on.
Deeper Dive
We introduced toplev.py in the last article to investigate how effectively an application utilizes CPU resources. Let’s use that tool again here to check the service on the SKX machine:
FE             Frontend_Bound                       % Slots              20.5
RET            Retiring                             % Slots              79.5
FE             Frontend_Bound.Fetch_Bandwidth       % Slots              20.4
FE             Frontend_Bound.Fetch_Bandwidth.MITE  % Core_Clocks        18.2
        This metric represents Core fraction of cycles in which CPU
        was likely limited due to the MITE pipeline (Legacy Decode
        Pipeline)...
        Sampling events:  frontend_retired.dsb_miss:pp
RET            Retiring.Light_Operations            % Slots              79.5
RET            Retiring.Light_Operations.Other      % Uops              100.0  <==
        This metric represents non-floating-point (FP) uop fraction
        the CPU has executed...
This service is mostly just humming along and retiring instructions, thus its ~3.3 IPC reading. But what about the service on the CLX host?
FE             Frontend_Bound                       % Slots              58.3
RET            Retiring                             % Slots              41.7
        This category represents fraction of slots utilized by
        useful work i...
        Sampling events:  uops_retired.retire_slots
FE             Frontend_Bound.Fetch_Latency         % Slots              33.3
FE             Frontend_Bound.Fetch_Bandwidth       % Slots              25.0
FE             Frontend_Bound.Fetch_Latency.DSB_Switches  % Clocks       16.7  <==
        This metric represents fraction of cycles the CPU was
        stalled due to switches from DSB to MITE pipelines...
        Sampling events:  frontend_retired.dsb_miss:pp
FE             Frontend_Bound.Fetch_Bandwidth.DSB   % Core_Clocks        16.7
        This metric represents Core fraction of cycles in which CPU
        was likely limited due to DSB (decoded uop cache) fetch
        pipeline...
FE             Frontend_Bound.Fetch_Bandwidth.MITE  % Core_Clocks        50.0
        This metric represents Core fraction of cycles in which CPU
        was likely limited due to the MITE pipeline (Legacy Decode
        Pipeline)...
        Sampling events:  frontend_retired.dsb_miss:pp
It appears the service on the CLX machine is Frontend Bound due to Decoded Stream Buffer (DSB) misses. DSB is Intel’s fancy name for its cache of previously decoded µOPs that avoids latency penalties of the legacy pipeline (MITE). In this case, we’re not utilizing the DSB as well as we do on the SKX, causing constant switches between reading from the DSB and the MITE.
Running “perf record -e frontend_retired.dsb_miss:pp -p <PID>” on the service helped me pinpoint the problematic functions. Finally, we recompiled the application using a “DSB-friendly” 32-byte code alignment for those functions. This resolved the low IPC issue, causing the service on the CLX to outperform (and out-earn) that of the SKX.
Thanks to the readily accessible IPC graph, problem identification took only a fraction of the time it could have taken.
NOTE: For an in-depth discussion of using hardware PMU counters for application performance analysis, check our our book Performance Analysis and Tuning on Modern CPUs.1Paid affiliate link
IPC Monitoring Saves The Day
Why would CLX and SKX, mostly identical CPU microarchitectures, show such vastly disparate Frontend behavior for the exact same binary? I verified that this CLX vs. SKX discrepancy persisted no matter which server manufacturer we tested against. Support Cases with Intel Engineering as well as various Server Vendor Support Teams yielded nothing. A colleague found an Intel erratum that seemed related but turned out not to be. Plus, both chip types in this story appear on its “Affected Processors” list, so it wouldn’t explain the difference in behavior.
Unanswered questions aside, what goes without question is that IPC tracking enabled a far quicker resolution than what would’ve been possible otherwise. CPU% usage alone was ok, and eliminated from suspicion a host of other possible culprits. But the IPC graph enhanced the flavor of our CPU% graph.
As I pour this next bowl of cereal, make sure your SREs add IPC to your monitoring stack. It doesn’t matter whether it be Grafana, TICK, ELK, Prometheus, or any other enterprise commercial tool. They deliciously go together like milk and Cinnamon Toast Crunch. But unlike several bowls of cereal in one sitting, you won’t regret it.
- 1Paid affiliate link
