
Estimated reading time: 9 minutes
“This is it – this is the year when I’m finally gonna do it!”, millions of optimists vowed while preening in front of a bathroom mirror on the morning of Jan. 1st. Yes, many of us use this time of year to make New Year’s Resolutions, personal pledges of self-improvement. Take a wild guess what the most popular pledge involves. Yep, you guessed it – fitness. According to a 2021 Statista study, 50% of us resolved to exercise more and 48% committed to losing weight.1https://www.statista.com/statistics/378105/new-years-resolution/ Yet, only about 4% of us ever achieve our resolution by year’s end according to a 2018 Statista study. I believe the reason behind these fitness resolution failures is the same reason why certain memory access patterns cause poor application performance. Bear with me here.
Back in the days when WFH was a rare perk reserved only for highly desirable candidates, 3 – 6 month long Office Weight Loss Competitions were popular. Frequently, some of the participants would solicit my help in winning these office pots that could get as large as $1,000 (of which I’d receive a cut). My involvement in these departmental showdowns reaffirmed for me my long-held fitness belief; namely, that finding a routine you can stick to is paramount to success. Not obsessing over types of lifts. Or whether to include HIIT or not. Or whether to eat 6 meals a day or only 1. It’s simply about finding consistency. I won a lot of money for myself and those who hired me by espousing that principle. Likewise, I’ve shaved a lot of application latency by introducing consistency into memory access patterns. Let’s examine why consistency is so important in both areas.
Table of contents
Fitness and Memory Access Pattern Consistency
Can you remember a time when you started a new workout routine after a long period of sedentary living? You were gung-ho that first day. But the following morning you felt soreness in muscles you didn’t even know existed.
“How will I ever manage to lift anything in my next session?”
But as you persevered, that debilitating post-workout soreness became less frequent. You gradually added more weight/reps/sets. Clothes fit you differently. People looked at you differently. Your consistency led to fitness success.
Remember later when you traveled to visit family for the holidays? Away from your home gym, you gave yourself a break from your routine and just enjoyed yourself. A month and 5 extra pounds later, you traveled back home and back to your regimen. “Wait. . . I can’t quite lift as much as I did a month ago! And not as many reps, either! And some of that familiar next-morning soreness has returned!” Inconsistency put you back a few steps. Not back to where you began after a completely sedentary lifestyle but a few steps back, nonetheless. That brief period of inconsistency led to *missed* workouts which, in turn, added delay along your fitness path.
Likewise, inconsistency in memory access patterns leads to *missed* CPU caches and DRAM row buffers, thereby adding delays in application performance. We’ll use lat_mem_rd to examine this inconsistency effect while gathering PMU metrics for Active Benchmarking purposes.
Demo
Our test machine is a dual-socket Intel Xeon Gold 6244 8-core CPU running CentOS 7.9, populated with six (6) 8GB DDR4 RDIMMs per socket (one DIMM per channel). All cores on the 2nd socket have been isolated with the isolcpus kernel boot parameter.
Below is a graph comparing two runs of lat_mem_rd, one executing consistent (sequential) array reads2numactl –membind=1 –cpunodebind=1 lat_mem_rd 1024m 128 and the other executing inconsistent (random) reads3numactl –membind=1 –cpunodebind=1 lat_mem_rd -t 1024m:
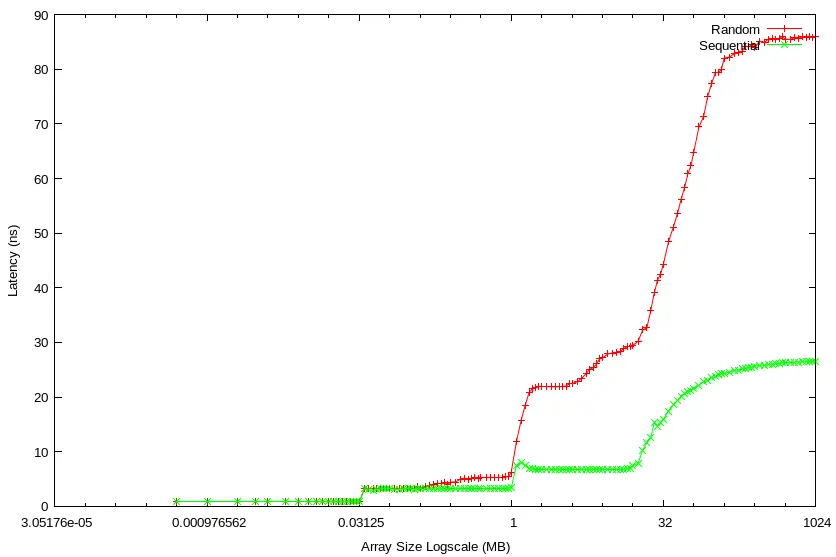
We clearly see latency shifts which correspond to different cache levels. It jumps to ~3ns at the 31.2KB array size after the L1d cache is exhausted. Then, it jumps again at 1MB after L2 exhaustion. Finally, it jumps the most at ~30MB after LLC exhaustion (i.e., RAM access).
I could stop here, satisfied with this visualization of wall-clock timings upon which, coupled with my intuition, I can base my conclusions about root causes. But if years in Performance Engineering have taught me anything, it’s that the ever-increasing complexity of compute platforms defies human intuition. If you take anything away from this article, let it be that you should *always* accompany benchmarks with system-level metrics. More often than not, you will find your presuppositions about how the world works challenged and your understanding of systems enriched. With that in mind, let’s gather some metrics, shall we?
perf stat
In the graph, the lines diverge around the L2 level. I suspect L2 cache misses as the culprit. Let’s compare snapshots of L2 stats between the two runs:
[root@eltoro]# perf stat -C 1 -e mem_load_retired.l1_miss:u,mem_load_retired.l2_miss:u  #SEQUENTIAL RUN

 Performance counter stats for 'CPU(s) 1':
     1,913,804,464      mem_load_retired.l1_miss:u
     1,544,918,118      mem_load_retired.l2_miss:u

[root@eltoro]# perf stat -C 1 -e mem_load_retired.l1_miss:u,mem_load_retired.l2_miss:u  #RANDOM RUN

 Performance counter stats for 'CPU(s) 1':
     1,279,287,712      mem_load_retired.l1_miss:u
     1,270,179,077      mem_load_retired.l2_miss:u
L2 miss rate for the sequential run (mem_load_retired.l2_miss / mem_load_retired.l1_miss) is 80.7%, while that of the random run is 99.3%: ~20 point difference.
The LLC latency margin is even greater than at L2 – 28ns vs. 7ns! Let’s compare LLC metrics:
[root@eltoro]# perf stat -C 1 -e mem_load_retired.l2_miss:u,mem_load_retired.l3_miss:u  #SEQUENTIAL RUN

 Performance counter stats for 'CPU(s) 1':
     1,544,918,118      mem_load_retired.l2_miss:u
     1,486,797,117      mem_load_retired.l3_miss:u


[root@eltoro]# perf stat -C 1 -e mem_load_retired.l2_miss:u,mem_load_retired.l3_miss:u  #RANDOM RUN

 Performance counter stats for 'CPU(s) 1':
     1,270,179,077      mem_load_retired.l2_miss:u
     1,248,998,190      mem_load_retired.l3_miss:u
That’s a 96.2% LLC miss rate for sequential vs. 98.3% for random. But a 2 point difference doesn’t feel like it explains that entire margin, does it? Besides, the change to non-inclusive LLCs starting with Skylake may require a slight mental model adjustment, anyway. Hmm, I’ll tell ya what – let’s table that for the moment and look at the RAM part of the graph.
Intel’s Memory Latency Checker mlc (which disables HW prefetching during operation) clocks my test machine’s Unloaded RAM Latency at 69.3ns:
[root@eltoro]# mlc --idle_latency
Intel(R) Memory Latency Checker - v3.9
Command line parameters: --idle_latency

Using buffer size of 2000.000MiB
Each iteration took 249.0 core clocks ( 69.3    ns)
Yet, the sequential memory access displays a max latency of only ~25ns. We can safely assume that this huge 44ns latency benefit derives from its predictability, facilitating optimum function from the HW prefetchers which hide RAM latency and increase hit rates at the CPU caches.
On the other hand, at a max of ~85ns, the random access pattern inflicts a 16ns penalty above the measured RAM unloaded latency!
What gives? How can we explain the huge latency differences at LLC and RAM?
Deeper Dive Into Memory Access Patterns
Let’s stop guessing and start tracking with PMU Tools, also known as the Poor Man’s Intel VTune. For those familiar with VTune, we’re about to do the equivalent of a “General Exploration”. For those unfamiliar with VTune, we’re gonna synthesize a bunch of PMU metrics to pinpoint bottleneck differences between both runs. The first PMU Tools utility we’ll use is TopLev, which embodies Intel’s Top Down Analysis Methodology.
TopLev
[root@eltoro]# toplev.py --single-thread -l4 numactl --membind=1 --cpunodebind=1 lat_mem_rd 1024m 128  #SEQUENTIAL RUN
# 4.11-full-perf on Intel(R) Xeon(R) Gold 6244 CPU @ 3.60GHz [clx/skylake]
BE             Backend_Bound                                            % Slots        97.1
BE/Mem         Backend_Bound.Memory_Bound                               % Slots        91.0
BE/Mem         Backend_Bound.Memory_Bound.L1_Bound                      % Stalls       24.5
BE/Mem         Backend_Bound.Memory_Bound.L2_Bound                      % Stalls       16.7
        This metric estimates how often the CPU was stalled due to
        L2 cache accesses by loads...
        Sampling events:  mem_load_retired.l2_hit:pp
BE/Mem         Backend_Bound.Memory_Bound.L3_Bound                      % Stalls       10.4
BE/Mem         Backend_Bound.Memory_Bound.DRAM_Bound                    % Stalls       33.7
BE/Mem         Backend_Bound.Memory_Bound.L1_Bound.FB_Full              % Clocks_calc  14.5
        This metric does a *rough estimation* of how often L1D Fill
        Buffer unavailability limited additional L1D miss memory
        access requests to proceed...
BE/Mem         Backend_Bound.Memory_Bound.L3_Bound.SQ_Full              % Clocks        1.0
        This metric measures fraction of cycles where the Super
        Queue (SQ) was full taking into account all request-types
        and both hardware SMT threads (Logical Processors)...
BE/Mem         Backend_Bound.Memory_Bound.DRAM_Bound.MEM_Bandwidth      % Clocks       32.5
        This metric estimates fraction of cycles where the core's
        performance was likely hurt due to approaching bandwidth
        limits of external memory (DRAM)...
BE/Mem         Backend_Bound.Memory_Bound.L3_Bound.L3_Hit_Latency       % Clocks_est   16.0
        This metric represents fraction of cycles with demand load
        accesses that hit the L3 cache under unloaded scenarios
        (possibly L3 latency limited)...
        Sampling events:  mem_load_retired.l3_hit:pp
BE/Mem         Backend_Bound.Memory_Bound.DRAM_Bound.MEM_Latency        % Clocks       19.4
        This metric estimates fraction of cycles where the
        performance was likely hurt due to latency from external
        memory (DRAM)...
This shows all the hallmarks of a core bandwidth bottleneck. We see Line Fill/Super Queue Buffer Full indications which, due to their limited number per-core, keep a single core from ever reaching full memory bandwidth capability. Also, of the attributes listed under “Backend_Bound.Memory_Bound.DRAM_Bound”, “MEM_Bandwidth” is the biggest bottleneck. Let’s compare this to the random run:
[root@eltoro]# toplev.py --single-thread -l4 numactl --membind=1 --cpunodebind=1 lat_mem_rd -t 1024m  #RANDOM RUN
# 4.11-full-perf on Intel(R) Xeon(R) Gold 6244 CPU @ 3.60GHz [clx/skylake]
BE             Backend_Bound                                            % Slots        91.5
BE/Mem         Backend_Bound.Memory_Bound                               % Slots        86.0
BE/Mem         Backend_Bound.Memory_Bound.L1_Bound                      % Stalls       24.5
BE/Mem         Backend_Bound.Memory_Bound.L2_Bound                      % Stalls        9.0
        This metric estimates how often the CPU was stalled due to
        L2 cache accesses by loads...
        Sampling events:  mem_load_retired.l2_hit:pp
BE/Mem         Backend_Bound.Memory_Bound.L3_Bound                      % Stalls       25.9
BE/Mem         Backend_Bound.Memory_Bound.DRAM_Bound                    % Stalls       30.0
BE/Mem         Backend_Bound.Memory_Bound.L1_Bound.DTLB_Load            % Clocks_est   17.1
        This metric roughly estimates the fraction of cycles where
        the Data TLB (DTLB) was missed by load accesses...
        Sampling events:  mem_inst_retired.stlb_miss_loads:pp
BE/Mem         Backend_Bound.Memory_Bound.L3_Bound.L3_Hit_Latency       % Clocks_est    6.9
        This metric represents fraction of cycles with demand load
        accesses that hit the L3 cache under unloaded scenarios
        (possibly L3 latency limited)...
        Sampling events:  mem_load_retired.l3_hit:pp
BE/Mem         Backend_Bound.Memory_Bound.DRAM_Bound.MEM_Latency        % Clocks       54.6
        This metric estimates fraction of cycles where the
        performance was likely hurt due to latency from external
        memory (DRAM)...
Based on comparison, random memory access stresses the TLB in a way that sequential access doesn’t. This provides more explanation for the latency margin from the L2 onward:
[root@eltoro]# perf stat -C 1 -e mem_inst_retired.stlb_miss_loads:u  #SEQUENTIAL RUN

 Performance counter stats for 'CPU(s) 1':
        59,751,742      mem_inst_retired.stlb_miss_loads:u

[root@eltoro]# perf stat -C 1 -e mem_inst_retired.stlb_miss_loads:u  #RANDOM RUN

 Performance counter stats for 'CPU(s) 1':
     1,268,859,691      mem_inst_retired.stlb_miss_loads:u
TLB misses for the random access exceed that of the sequential one by a factor of 21! Unlike random access, sequential access benefits from the next page HW prefetcher. It pre-loads TLB entries when striding across page boundaries (this used to only be possible using software prefetching).
Lastly, “MEM_Latency” for the random access is much higher than for sequential (59.6% vs. 19.4%). Let’s take a brief detour to discuss DRAM basics and its latency implications before analyzing Memory Controller metrics.
NOTE: For an in-depth discussion on using perf for profiling and reading hardware PMU counters for application performance analysis, check out our book Performance Analysis and Tuning on Modern CPUs.4Paid affiliate link
DRAM Basics
Memory requests from the CPU proceed from the on-die Memory Controller, to a channel, to a DIMM rank, to a DRAM bank, to a bank row, and finally a bank column. Most people are familiar with the first three stops, but the latter three may be less understood.
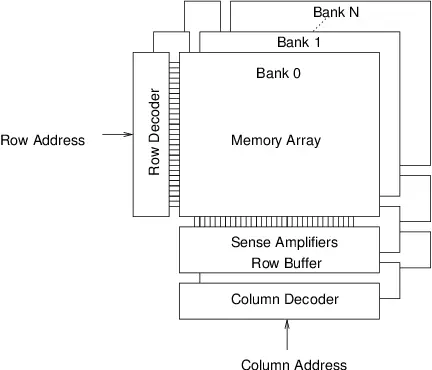
Pictured above is the DRAM Logical Architecture. Physically, each DIMM Rank comprises multiple DRAM chips which operate in unison to respond to I/O requests. Logically, each rank comprises multiple banks (usually 8 or 16), which offer I/O request level parallelism.
Each bank is a 2D array of cells with thousands of 8KB-sized rows and thousands of columns. Reading one cell within a row requires selecting that entire row (or Activate in DRAM parlance), pulling its data into the Sense Amplifiers (aka “row buffer” or “DRAM page”), and then finally selecting the column within that row (Read in DRAM parlance) to send out through the data bus. If a subsequent I/O request for data within that same row arrives, it only needs to access the “row buffer” since it’s still populated from the previous request. This is called a page hit. However, if a new request for a different row within that same bank arrives, it must first close (or Precharge in DRAM parlance) the currently activated row, and then Activate the new row. This is called a page miss.
Using the DDR4 RDIMMs in this demo machine as an example (RAM Timings of 22-22-22), a page miss costs 3x as many cycles as a page hit! Granted, modern Memory Controllers employ adaptive techniques to mitigate this latency impact, but it by no means removes it. Therefore, our aim is to access memory in a way which enables reuse of its large 8KB row buffers. Consistent memory access patterns achieve just that.
With this background in place, let’s seek more insight into the RAM latency differences between our sequential and random lat_mem_rd runs by tracking uncore metrics with PMU Tool’s UcEvent.
UcEvent
UcEvent tracks UnCore Events, and the Memory Controller is part of the Uncore. For the sake of brevity, I took a snapshot at 5-second intervals of the DRAM Page Miss Rates of both runs starting from the array size of 100MB up through 1024MB:
[root@eltoro]# ucevent.py --socket 1 iMC.PCT_REQUESTS_PAGE_MISS --interval 5000  #SEQUENTIAL RUN
iMC0.PCT_REQUESTS_PAGE_MISS
|      iMC1.PCT_REQUESTS_PAGE_MISS
|      |      iMC2.PCT_REQUESTS_PAGE_MISS
|      |      |      iMC3.PCT_REQUESTS_PAGE_MISS
|      |      |      |      iMC4.PCT_REQUESTS_PAGE_MISS
|      |      |      |      |      iMC5.PCT_REQUESTS_PAGE_MISS
4.34   4.35   4.33   4.35   4.32   4.38
5.14   5.14   5.13   5.15   5.10   5.17
5.64   5.63   5.63   5.64   5.59   5.66
6.00   6.00   5.98   6.00   5.96   6.02
7.10   7.07   7.08   7.09   7.03   7.11
7.23   7.12   7.16   7.12   7.14   7.13
7.41   7.25   7.29   7.25   7.31   7.26
9.54   9.32   9.41   9.34   9.41   9.35
9.70   9.49   9.57   9.51   9.58   9.51
9.60   9.37   9.46   9.38   9.46   9.40
9.64   9.42   9.51   9.46   9.52   9.46
9.62   9.41   9.50   9.41   9.49   9.42
9.68   9.45   9.55   9.48   9.56   9.48

[root@eltoro]# ucevent.py --socket 1 iMC.PCT_REQUESTS_PAGE_MISS --interval 5000  #RANDOM RUN
iMC0.PCT_REQUESTS_PAGE_MISS
|      iMC1.PCT_REQUESTS_PAGE_MISS
|      |      iMC2.PCT_REQUESTS_PAGE_MISS
|      |      |      iMC3.PCT_REQUESTS_PAGE_MISS
|      |      |      |      iMC4.PCT_REQUESTS_PAGE_MISS
|      |      |      |      |      iMC5.PCT_REQUESTS_PAGE_MISS
12.30  11.82  11.84  11.77  12.16  11.76
12.67  12.30  12.25  12.21  12.54  12.16
14.51  14.31  14.29  14.28  14.36  14.22
14.35  13.95  14.02  13.89  14.17  13.92
14.64  14.34  14.34  14.28  14.49  14.26
14.65  14.26  14.29  14.13  14.40  14.18
14.56  14.15  14.18  14.06  14.34  14.05
14.40  14.15  14.22  14.14  14.32  13.99
14.53  14.34  14.24  14.28  14.38  14.11
14.88  14.63  14.49  14.53  14.63  14.36
14.55  14.28  14.16  14.25  14.30  14.03
14.74  14.39  14.36  14.38  14.46  14.22
14.85  14.59  14.58  14.57  14.72  14.47
14.65  14.41  14.36  14.38  14.51  14.31
14.94  14.64  14.62  14.62  14.73  14.58
14.85  14.60  14.41  14.44  14.52  14.20
14.79  14.58  14.45  14.67  14.74  14.45
14.44  14.16  14.20  14.23  14.27  14.08
15.19  14.93  14.84  14.88  14.83  14.74
14.56  14.23  14.15  14.25  14.38  14.19
14.78  14.49  14.41  14.50  14.44  14.31
15.04  14.88  14.74  14.85  14.99  14.79
14.94  14.54  14.52  14.49  14.77  14.37
14.88  14.68  14.63  14.75  14.83  14.62
15.07  14.74  14.50  14.59  14.76  14.49
Since the random access run took longer to complete than the sequential run, it has a longer 5-second interval output.
For the consistent, sequential run, page miss rate ranges from 4% across all memory channels to a max of 9.5%. Meanwhile, that same range for the inconsistent, random run starts at 12% (3x the sequential run) up to 15%.
Just because it’s called Random Access Memory doesn’t mean you should access it that way.
Consistent Memory Access Patterns FTW
Inconsistency is the #1 killer of New Year’s Fitness Resolutions. Overambitious exercise and diet regimens breed inconsistency that leads to missed workouts, missed protein feedings, missed hours of sleep, etc. These missed opportunities only delay you along your path to that healthy BMI.
Likewise, poorly chosen data structures and algorithms breed inconsistent memory access patterns that lead to missed HW prefetch opportunities and missed L1d, L2, TLB, LLC, and DRAM row buffers. These misses only delay your application along its path to achieving its goal within its prescribed SLA. Therefore, support Mechanical Sympathy by paying close heed to your application’s memory access patterns.
Happy New Year and good luck on your 2022 fitness resolutions!
- 1https://www.statista.com/statistics/378105/new-years-resolution/
- 2numactl –membind=1 –cpunodebind=1 lat_mem_rd 1024m 128
- 3numactl –membind=1 –cpunodebind=1 lat_mem_rd -t 1024m
- 4Paid affiliate link
