
Estimated reading time: 10 minutes
This month marks the 140th Anniversary of the “Gunfight at the O.K. Corral” between the Earps and the Cowboys. Legend has it this conflict started from the outlaws’ violation of a city ordinance to hand over firearms while inside city limits. Lawman Virgil Earp, his brothers, and Doc Holiday confronted them in order to disarm them. That fateful meeting ended in a deadly 30-second shootout that has since been memorialized in print, film, and television. Similarly, we stipulate an ordinance by which platforms must abide, as well. An ordinance that dictates low-to-no system disturbance to our applications. And yet, despite clear orders, platform shootouts can and still do occur. Known as TLB Shootdowns, these outbreaks of binary violence pose substantial risks to multithreaded application latency. In this article, I’ll demonstrate deterrence and disarming methods which should help resolve confrontations more peaceably than that infamous encounter in Tombstone.
Table of contents
What Are TLB Shootdowns?
Per-core units called Translation Lookaside Buffers (TLB) cache recent virtual -> physical memory page translations. Thus, they reduce memory reference latency by limiting the need to traverse the in-memory, 3 – 5 level kernel page table for completion of that translation. While this sounds analogous to the benefit offered by per-core L1/L2 caches, there is an important distinction: hardware-based Cache Coherence Protocols (e.g., MESIF, MOESI, etc.) maintain L1/L2 consistency. But no such hardware support exists for TLB consistency maintenance; therefore, this responsibility falls upon the kernel itself. The Linux kernel fulfills this role by means of inter-processor interrupts (IPIs) called TLB Shootdowns.
Sources of TLB Shootdowns
In a multithreaded application, process threads share the same address space. Therefore, the kernel must communicate certain types of address space changes to the TLB of any core running any of those threads.1Linux used to track the list of interested cores in the cpu_vm_mask_var member of the process’s mm_struct, but this tracking method seems to have changed with v4.19. Syscalls such as munmap, mprotect, and madvise effect these types of changes. Though a developer can avoid explicitly using these syscalls in his code, TLB Shootdowns may still erupt from other sources.
A Real World Example
Several years ago at a former employer, we planned to upgrade our trading infrastructure from CentOS 6,8 to CentOS 7. Essentially, this involved a v2.6 to v3 kernel upgrade. In the R&D Lab, our flagship algorithmic trading application suddenly began incurring sporadic latency spikes in the tens to hundreds of microseconds! Preliminary investigation led to a discovery like this in /proc/interrupts:
           CPU0       CPU1       CPU2       CPU3       CPU4       CPU5       CPU6       CPU7

 45:          0          0          0          0          0          0          0          0   PCI-MSI-edge      eth0
 46:     192342          0          0          0          0          0          0          0   PCI-MSI-edge      ahci
 47:         14          0          0          0          0          0          0          0   PCI-MSI-edge      mei

NMI:          0          0          0          0          0          0          0          0   Non-maskable interrupts
LOC:     552219    1010298    2272333    3179890    1445484    1226202    1800191    1894825   Local timer interrupts
SPU:          0          0          0          0          0          0          0          0   Spurious interrupts

IWI:          0          0          0          0          0          0          0          0   IRQ work interrupts
RTR:          7          0          0          0          0          0          0          0   APIC ICR read retries
RES:      18708       9550        771        528        129        170        151        139   Rescheduling interrupts
CAL:        711        934       1312       1261       1446       1411       1433       1432   Function call interrupts
TLB:       4493       6108      73789       5014       1788       2327       1967        914   TLB shootdowns
Notice the order of magnitude difference in TLB Shootdowns between CPU2, where our latency-critical thread ran, and other cores. A stack trace on native_flush_tlb_others() (the kernel function behind TLB Shootdowns) uncovered frequent calls from task_numa_work(). This tidbit exposed as the culprit a new v3 kernel feature called Auto NUMA Balancing, which tinkers with process address space mappings on a periodic basis. Its runtime fiddling produced bursts of TLB Shootdowns. Luckily, a simple sysctl -w numa_balancing=0 disarmed it peacefully.
Other Sources
But that’s not the only source of TLB Shootdowns. Others include Transparent Huge Pages, memory compaction, page migration, and page cache writeback. General purpose memory allocator libraries such as ptmalloc2 and garbage collectors for popular languages like Java are other examples.
But what are the latency implications of TLB Shootdowns, and what factors influence the magnitude of impact?
Impact of TLB Shootdowns
To gain a better grasp of TLB Shootdown impact, let’s break down how it works in more detail. As we discussed previously, the kernel employs IPIs for shootdowns. So, let’s say for example, you’ve executed mprotect() in one of the threads in a multithreaded app. Here’s what happens in the kernel:
- The kernel calls native_flush_tlb_others()
- It fills out a flush_tlb_info struct with info on the parts of the address space that must be flushed, sets this struct as the argument to the flush_tlb_func() callback function, and then calls smp_call_function_many() with a cpu mask, the aforementioned callback function, and the struct as its function parameters
- smp_call_function_many() then appends that callback function & struct to the per-cpu “call_single_function” linked list of each core in the supplied cpumask using llist_add_batch()
- The kernel then sends IPIs to each core in the aforementioned cpumask in a “for loop” in __x2apic_send_IPI_mask()
- Each core which receives the IPI executes the flush_tlb_func() callback in its “call_single_function” queue in interrupt mode, clearing the TLB entries specified therein
- The core which originated the IPIs to each of the cores in the cpumask then waits for each one to complete its callback routine in another “for loop”
- Once all cores have completed its flush_tlb_func() callback, the originating core can finally return to user mode execution
Latency Implications
From the aforementioned 7-step description, we get a better understanding of the latency-critical chokepoints. They include:
- The amount of flushing to be performed as described in the flush_tlb_info struct
- The number of cores in the cpumask which dictates the loop count in __x2apic_send_IPI_mask()
- The transition from ring 3 to ring 0 on each receiving core upon receipt of the IPI to execute the ISR
- Worst of all, the wait for completion ACKs from all receiving cores at the sending core before it can proceed2The wait can be even longer if certain cores have interrupts temporarily disabled during receipt of the IPI.
Let’s consider a microbenchmark to gauge its latency impact as we scale the number of threads.
Sample Microbenchmark
I’ve adapted Stijn Schilderman’s microbenchmark which loops over calls to madvise() 1,000,000 times with a varying number of threads. My updates to his source code include:
- adding a command line parameter for “thread count”
- pinning each thread to its own core
- synchronizing the loops across threads with a barrier
- timing each thread’s loop
pthread_barrier_t barrier;

void* madv(void* mem)
{
  pthread_barrier_wait(&barrier);

  std::chrono::steady_clock::time_point begin = std::chrono::steady_clock::now();
  for (int i = 0;i < 1'000'000; i++)
  {
    madvise(*((char**) mem), 4096, MADV_DONTNEED);
  }
  std::chrono::steady_clock::time_point end = std::chrono::steady_clock::now();
  std::cout << "Time difference = " << std::chrono::duration_cast<std::chrono::milliseconds>(end - begin).count() << "[ms]" << std::endl;
  return 0;
}

int main(int argc, char** argv)
{
  void *mem;
  posix_memalign(&mem, 4096, 8192);

  auto thread_count = atoi(argv[1]);
  auto barrier_count = thread_count + 1;
  pthread_barrier_init(&barrier, nullptr, barrier_count);

  pthread_t threads[thread_count];
  pthread_attr_t attr;
  pthread_attr_init(&attr);
  pthread_attr_setscope(&attr, PTHREAD_SCOPE_SYSTEM);
  cpu_set_t cpus;

  for (int i = 0; i < thread_count; i++)
  {
    CPU_ZERO(&cpus);
    CPU_SET(i, &cpus);
    pthread_attr_setaffinity_np(&attr, sizeof(cpu_set_t), &cpus);
    pthread_create(&threads[i], &attr, madv, &mem);
  }

  sleep(2); pthread_barrier_wait(&barrier);

  for (int i = 0; i < thread_count; i++)
  {
    pthread_join(threads[i], nullptr);
  }
  return 0;
}
Latency Breakdown
Averaging the loop workload runtimes at each successive thread count iteration yields the following graph:
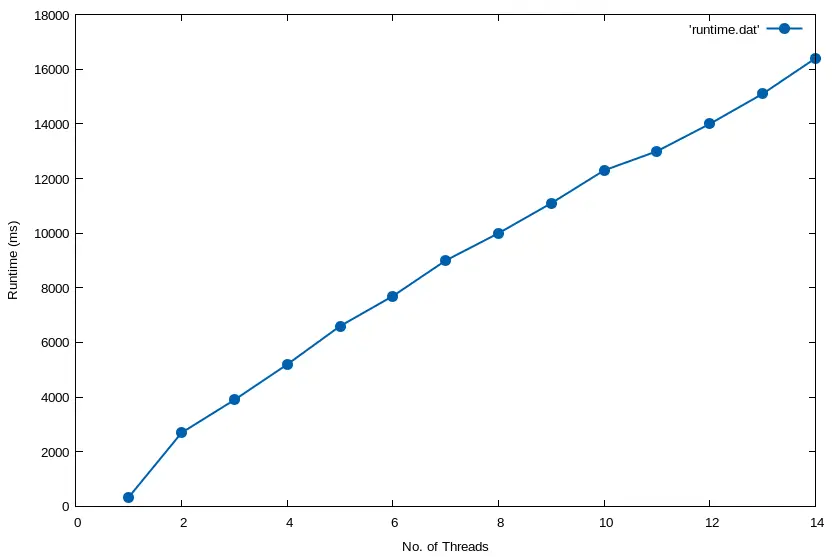
With a single thread, when no TLB Shootdowns need occur, it only takes 342ms to complete the loop. But when we go from 1 to 2 threads, we see TLB Shootdowns take effect with a huge runtime jump to 2,700ms. It scales pretty linearly from there on out to a maximum runtime average of 16,400ms at 14 threads. To reiterate, these numbers represent the duration it takes to complete the same, unchanging madvise() workload loop – the *only* thing that changes is the number of concurrent threads.
Notice how the number of TLB Shootdowns and flushes scale as we go from 2 to 8 to 14 threads:
[root@eltoro]# perf stat -r 3 -e probe:native_flush_tlb_others,tlb_flush.stlb_any chrt -f 90 ./madv 2

 Performance counter stats for 'chrt -f 90 ./madv 2' (3 runs):

         3,958,266      probe:native_flush_tlb_others                        ( +-  0.28% )
         7,928,801      tlb_flush.stlb_any                                   ( +-  0.24% )

[root@eltoro]# perf stat -r 3 -e probe:native_flush_tlb_others,tlb_flush.stlb_any chrt -f 90 ./madv 8

 Performance counter stats for 'chrt -f 90 ./madv 8' (3 runs):

        15,946,430      probe:native_flush_tlb_others                        ( +-  0.03% )
       123,288,313      tlb_flush.stlb_any                                   ( +-  0.05% )

[root@eltoro]# perf stat -r 3 -e probe:native_flush_tlb_others,tlb_flush.stlb_any chrt -f 90 ./madv 14

 Performance counter stats for 'chrt -f 90 ./madv 14' (3 runs):

        27,986,605      probe:native_flush_tlb_others                        ( +-  0.01% )
       376,502,522      tlb_flush.stlb_any                                   ( +-  0.01% )
Lastly, notice the latency distribution shift for native_flush_tlb_others() in lockstep with the increase in core count. Recall that it must iterate over the number of cores to send IPIs. Then, it must wait for all completed acks:
[root@eltoro]# funclatency.py -p 37344 native_flush_tlb_others
Tracing 1 functions for "native_flush_tlb_others"... Hit Ctrl-C to end.
^C
     nsecs               : count     distribution
         0 -> 1          : 0        |                                        |
         2 -> 3          : 0        |                                        |
         4 -> 7          : 0        |                                        |
         8 -> 15         : 0        |                                        |
        16 -> 31         : 0        |                                        |
        32 -> 63         : 0        |                                        |
        64 -> 127        : 0        |                                        |
       128 -> 255        : 0        |                                        |
       256 -> 511        : 0        |                                        |
       512 -> 1023       : 87926    |                                        |
      1024 -> 2047       : 3861380  |****************************************|
      2048 -> 4095       : 32924    |                                        |
      4096 -> 8191       : 3628     |                                        |
      8192 -> 16383      : 543      |                                        |
     16384 -> 32767      : 526      |                                        |
     32768 -> 65535      : 7        |                                        |
     65536 -> 131071     : 0        |                                        |
    131072 -> 262143     : 0        |                                        |
    262144 -> 524287     : 0        |                                        |
    524288 -> 1048575    : 0        |                                        |
   1048576 -> 2097151    : 0        |                                        |
   2097152 -> 4194303    : 11       |                                        |

avg = 1398 nsecs, total: 5582920090 nsecs, count: 3991212

[root@eltoro]# funclatency.py -p 37600 native_flush_tlb_others
Tracing 1 functions for "native_flush_tlb_others"... Hit Ctrl-C to end.
^C
     nsecs               : count     distribution
         0 -> 1          : 0        |                                        |
         2 -> 3          : 0        |                                        |
         4 -> 7          : 0        |                                        |
         8 -> 15         : 0        |                                        |
        16 -> 31         : 0        |                                        |
        32 -> 63         : 0        |                                        |
        64 -> 127        : 0        |                                        |
       128 -> 255        : 0        |                                        |
       256 -> 511        : 0        |                                        |
       512 -> 1023       : 24       |                                        |
      1024 -> 2047       : 224605   |                                        |
      2048 -> 4095       : 9608508  |****************************************|
      4096 -> 8191       : 6012919  |*************************               |
      8192 -> 16383      : 18881    |                                        |
     16384 -> 32767      : 2468     |                                        |
     32768 -> 65535      : 66       |                                        |
     65536 -> 131071     : 41       |                                        |
    131072 -> 262143     : 39       |                                        |
    262144 -> 524287     : 16       |                                        |
    524288 -> 1048575    : 72       |                                        |
   1048576 -> 2097151    : 0        |                                        |
   2097152 -> 4194303    : 86       |                                        |
   4194304 -> 8388607    : 3        |                                        |

avg = 3891 nsecs, total: 62126896400 nsecs, count: 15963897

[root@eltoro]# funclatency.py -p 37786 native_flush_tlb_others
Tracing 1 functions for "native_flush_tlb_others"... Hit Ctrl-C to end.
^C
     nsecs               : count     distribution
         0 -> 1          : 0        |                                        |
         2 -> 3          : 0        |                                        |
         4 -> 7          : 0        |                                        |
         8 -> 15         : 0        |                                        |
        16 -> 31         : 0        |                                        |
        32 -> 63         : 0        |                                        |
        64 -> 127        : 0        |                                        |
       128 -> 255        : 0        |                                        |
       256 -> 511        : 0        |                                        |
       512 -> 1023       : 23       |                                        |
      1024 -> 2047       : 158263   |                                        |
      2048 -> 4095       : 990737   |*                                       |
      4096 -> 8191       : 22814615 |****************************************|
      8192 -> 16383      : 3699448  |******                                  |
     16384 -> 32767      : 15401    |                                        |
     32768 -> 65535      : 676      |                                        |
     65536 -> 131071     : 53       |                                        |
    131072 -> 262143     : 83       |                                        |
    262144 -> 524287     : 28       |                                        |
    524288 -> 1048575    : 169      |                                        |
   1048576 -> 2097151    : 179      |                                        |
   2097152 -> 4194303    : 131      |                                        |

avg = 6610 nsecs, total: 184948768204 nsecs, count: 27976588NOTE: For an in-depth discussion on using perf for profiling and reading hardware PMU counters for application performance analysis, check out our book Performance Analysis and Tuning on Modern CPUs.3Paid affiliate link
Active Benchmarking
You guys know by now that I never post results without adhering to the Active Benchmarking methodology. So, let’s see what was going on system-wide while this microbenchmark was running.
Here’s the top -H output during the 8-thread run, which clearly shows a CPU-bound workload:
top - 10:28:48 up 19 days, 20:18, 12 users,  load average: 1.10, 0.85, 0.54
Threads: 831 total,  14 running, 817 sleeping,   0 stopped,   0 zombie
%Cpu(s):  1.9 us, 26.7 sy,  0.0 ni, 71.3 id,  0.0 wa,  0.0 hi,  0.0 si,  0.0 st
KiB Mem : 32641888 total, 15656160 free,  6306076 used, 10679652 buff/cache
KiB Swap:  8388604 total,  7868156 free,   520448 used. 25766320 avail Mem

 P   PID  TGID USER     %CPU %MEM  PR    VIRT    RES S     TIME+ WCHAN      COMMAND
 1 78090 78088 root     99.9  0.0 -91   80416   1108 R   0:03.27 ?          madv
 7 78096 78088 root     99.9  0.0 -91   80416   1108 R   0:03.27 ?          madv
 2 78091 78088 root     99.9  0.0 -91   80416   1108 R   0:03.26 ?          madv
 3 78092 78088 root     99.9  0.0 -91   80416   1108 R   0:03.26 ?          madv
 5 78094 78088 root     99.9  0.0 -91   80416   1108 R   0:03.26 ?          madv
 0 78089 78088 root     99.9  0.0 -91   80416   1108 R   0:03.26 ?          madv
 4 78093 78088 root     99.9  0.0 -91   80416   1108 R   0:03.26 ?          madv
 6 78095 78088 root     99.9  0.0 -91   80416   1108 R   0:03.26 ?          madv
24 78023 78023 mdawson   1.3  0.0  20  162980   3040 R   0:00.26 -          top
And here’s the system-wide perf top breakdown of where this CPU-bound workload spends its cycles:
  23.34%  [kernel]                            [k] smp_call_function_many
   7.87%  [kernel]                            [k] llist_add_batch
   7.15%  [kernel]                            [k] native_flush_tlb_single
   5.85%  [kernel]                            [k] irq_return
   5.14%  [kernel]                            [k] flush_smp_call_function_queue
   3.84%  [kernel]                            [k] native_write_msr_safe
   3.01%  [kernel]                            [k] flush_tlb_func
   2.83%  [kernel]                            [k] llist_reverse_order
   1.94%  [kernel]                            [k] __x2apic_send_IPI_mask
   1.48%  [kernel]                            [k] retint_userspace_restore_args
   1.34%  [kernel]                            [k] sysret_check
   1.32%  [kernel]                            [k] call_function_interrupt
   1.16%  [kernel]                            [k] find_next_bit
   1.01%  [kernel]                            [k] tlb_finish_mmu
   0.85%  libc-2.17.so                        [.] __madvise
   0.84%  [kernel]                            [k] _raw_spin_lock
   0.83%  [kernel]                            [k] rcu_irq_exit
   0.73%  [kernel]                            [k] cpumask_next_and
   0.68%  [kernel]                            [k] down_read
   0.66%  [kernel]                            [k] rcu_irq_enter
   0.62%  [kernel]                            [k] tlb_gather_mmu
   0.53%  [kernel]                            [k] irq_work_run_list
   0.50%  [vdso]                              [.] __vdso_clock_gettime
These snapshots provide further assurance that we’re benchmarking exactly what we intended to measure. Notice that all the functions catalogued above are associated with those outlined in the 7-step description from the previous section.
Deterrence Techniques
It’s clear that TLB Shootdowns present a sizeable latency effect on multithreaded applications as thread/core counts grow. But what can we do about them? Are there any tried-and-true deterrence techniques for these outlaw shootouts?
If you have access to source code, then the solution is simple: pre-allocate and then never return memory. Real-time guys used to adjust Glibc’s allocator with mallopt() and mlockall() to achieve this. But that doesn’t help when you have no source code access – e.g., Java Garbage Collectors or commercial applications.
Fortunately, several available LD_PRELOAD-able malloc alternatives achieve similar results solely by virtue of sacrificing memory efficiency in a manner akin to the Glibc method.4Examples include jemalloc and tcmalloc. But neither of these deterrence techniques address inefficiencies in the predominate, SW-controlled TLB Shootdown process itself.
Disarming Techniques
And that’s what makes this latest experimental feature proposal from Intel so exciting! Called Remote Action Request (RAR), it provides HW support for critical parts of the TLB Shootdown process. I encourage you to read the document for the finer points. But here it is in a nutshell in terms of the 7-step process detailed earlier:
- At Step #4, instead of an IPI, we send an RAR signal to each designated core
- At Step #5, the target core receives the RAR and processes the flush *entirely in HW*
- Since the TLB Shootdown is no longer an IPI which must be serviced via an ISR, it does not require that the target core transition from ring 3 to ring 0
- This HW-based handling of the shootdown will reduce substantially the time it takes to complete the tlb flush operation which, in turn, means the sending core will spend far less time waiting for completion ACKs
In other words, EVERYBODY wins – the sending *and* the receiving cores! With the steady trend of more and more cores per CPU, it’s about time this capability made it into HW. Look for it in the upcoming Sapphire Rapids microarchitecture.
Maintaining the Peace
Like Virgil Earp in the town of Tombstone, you’re the marshal in your datacenter. And the local ordinance is for peace and tranquility for all applications running in your jurisdiction. This article outlines the tools at your disposal for deterring or disarming violent, disruptive TLB Shootdowns. Also, it highlights incoming HW-based reinforcements for limiting the damage of those that erupt despite our best efforts.
And who knows? Maybe like the “Gunfight at O.K. Corral”, they’ll memorialize your heroics in video form, too, at P99, PAC, and ICPE conferences around the world. Only with a happier ending.
“I’m your huckleberry.”
Val Kilmer as “Doc Holiday” in TOMBSTONE (1993)
- 1Linux used to track the list of interested cores in the cpu_vm_mask_var member of the process’s mm_struct, but this tracking method seems to have changed with v4.19.
- 2The wait can be even longer if certain cores have interrupts temporarily disabled during receipt of the IPI.
- 3Paid affiliate link
- 4Examples include jemalloc and tcmalloc.
