
Estimated reading time: 14 minutes
Ever tipped a mediocre waiter 20% only to discover later that you *tremendously* over-tipped since 18% had been already included? Or installed software that changed your default search engine to Bing before you realized? Or purchased a gift from an online retailer which automatically opted you into its annoying newsletter and monthly catalogue? Now you’re stuck with less cash, suboptimal search results, and a cluttered inbox/mailbox, all from being oblivious to secret defaults. Upgrades inflict the same kind of pain. For example, when you upgrade to the most recent Linux distro on the latest CPUs, you’re automatically enrolled in 5-level page tables (up from 4-level). Is that a big deal? Will this automatic opt-in impact you like the aforementioned automatic gratuity or search engine change or mailing list subscription?
To answer these questions, we’ll discuss the purpose of page tables, the motivation for moving from 4 to 5 levels, and its performance implications. Along the way, we’ll run a couple experiments with some Active Benchmarking layered in.
Table of contents
But first. . . my ultimate recommendation
In my personal life, I’m more of a “Why not?” guy. Spar a bigger guy at the boxing gym – why not? Go jump out of a plane to conquer my fear of heights – why not? Approach that cute stranger I noticed while out on my lunch break and ask her out – why not? But in my duties as a Performance Engineer, I’m a “Why?” guy. There must be a compelling reason for me to adopt something new in Production.
Therefore, in the interest of not burying the lead, I recommend disabling 5-level page tables if your machine doesn’t contain more than 64TB of RAM. Disabling it is as simple as adding “no5lvl” to your kernel boot parameter list. You can check whether your system has this feature enabled by running “lscpu | grep -i la57“.
And now onto the show!
Purpose of Page Tables
Our applications use virtual addresses for code and data, but these must be translated to physical addresses that the HW works with. Therefore, every memory access requires a virtual-to-physical address translation performed by the per-core Memory Management Unit (MMU). The MMU consults an in-memory data structure to facilitate this function.
Making this data structure a linear array of 1-to-1 virt-to-phys mappings for every process would be wasteful since apps typically use only a fraction of the available virtual address space. So, a sparse multi-level radix tree is used, instead. This tree is known as the “page table”. When an app references memory at virtual address 0x7fdbef789000, the MMU walks this in-memory page table to find its associated physical address.
“Ok, so then what’s the story on the 4-level vs. 5-level controversy? Why should I care?” Well, recall that every memory reference requires the MMU to perform this virt-to-phys translation. So we want that process to be as fast as possible for performance. Let’s dive a little more deeply into this MMU walking process to get a better grasp on this topic.
Page Table Walking
Your app malloc()s some memory which returns a 64-bit pointer to its address. While the datatype used to store this pointer is 64 bits in size, only 48 of those bits participate in the MMU translation process on relatively recent CPUs. The remainder is sign extended from bit 47. Now, let’s say your app wants to write to that malloc()-ed address space – that’s when the MMU jumps into action.
It splits the top 36 of those 48 bits into four (4) groups of 9 bits, each of which indexes into a descending level of page tables before it reaches the physical address of a page in RAM. The final 12 bits of the 48-bit virtual address represent the offset into the aforementioned physical page.
NOTE: The CR3 register depicted below contains the physical address of the top-level of the page table for the scheduled process.
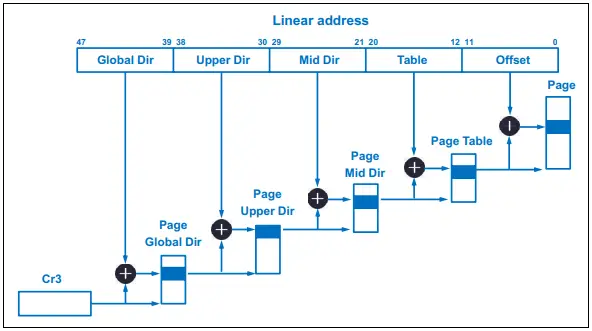
As illustrated in Fig. 1, bits 47 – 39 form an index to an entry in the Page Global Directory (PGD) which holds the physical address of a Page Upper Directory (PUD). Bits 38 – 30 index to an entry of that PUD which, in turn, holds the physical address of a Page Middle Directory (PMD). Then, bits 29 – 21 index to an entry of that PMD which holds the physical address of a Page Table Entry (PTE). Next, bits 20 – 12 index to an entry of that PTE which holds the physical address of the 4KB page in RAM. Finally, the last 12 bits select the offset within that 4KB page. That is the MMU page table walk process in a nutshell.
It would really suck for performance if every translation required the MMU to go through that entire walk process. After all, we know full well how expensive RAM access is. Let’s briefly discuss some of the structures that help speed up the process.
Translation Lookaside Buffer (TLB)
Just like every core on a CPU contains multiple levels of instruction and data caches, it also contains multiple levels of TLBs. These structures cache the results of MMU page walks to reduce the need for walking the page table in the near term. Due to its associativity level and limited size, the TLB rarely offers a 100% hit rate. But coding and OS configuration techniques both help increase its caching effectiveness.
Paging Structure Caches
Both Intel and AMD utilize special caches for the upper page levels in the hierarchy in the event of a TLB miss. Looking back at Fig. 1, these caches would hold info about the PGD, PUD, and PMD levels of the page table. TLBs cache the final PTE level info.
Intel refers to these caches as Paging Structure Caches while AMD refers to them as Page Walk Caches. While organization specifics differ, each serves the purpose of lightening the MMU load in the event of a TLB miss.
From 4 to 5 levels – Why?
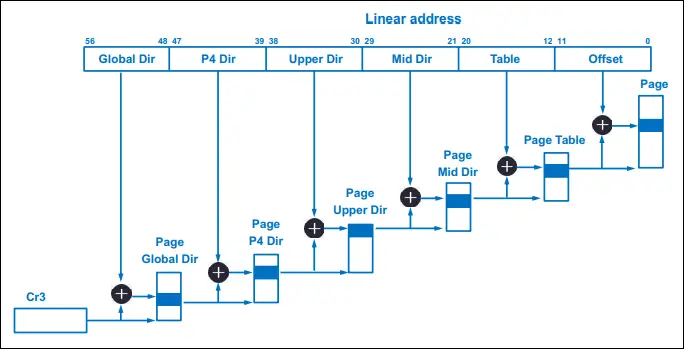
Unfortunately, 4-level page tables and 48-bit virtual addresses are only good for a measly 64TB of RAM. Of what use is that pittance?!? Seriously, though, modern architectures built around memory disaggregation-enabling protocols like CCIX, CXL, and Gen-Z will turn 64TB into the 21st Century version of Bill Gates’ oft-quoted but misattributed 640KB. To break through that RAM limit, the usable virtual address bits were extended from 48 to 57 bits. That extra group of 9 bits indexes into a 5th page table level, the Page P4 Directory (P4D), illustrated below in Fig. 2.
There you have it! If you’ll need more than 64TB of RAM in the near future, you’re ecstatic about this new default kernel option. But what about the vast majority that comprises the rest of us? Should *we* be happy with this “automatic gratuity”?
Benchmarking 4-level vs. 5-level Page Tables
As I’ve written before in past articles, there is no benchmark quite like your own application – the very one that you run in Production, the one upon which your company depends. So that’s exactly what I did. I ran a comparison between both modes in my R&D lab. And the results? Nada. Nothing. Zilch. No measurable impact.
But wait! You gotta remember that my shop is all about low latency trading. This means, for our trading apps which run in software, we employ all the optimal coding and configuration tips alluded to in prior articles. Optimal L1d cache usage, cache warming, thread pinning, small working memory footprint, huge pages, pre-faulting, TLB Shootdown prevention, fine-tuned DDIO, kernel bypass, etc.. Our TLB miss rate is infinitesimal to the point of being a non-factor. And whatever miss rate we do incur, I’m certain the Intel Paging Structure Caches pickup the slack enough to drastically minimize MMU page walks given our memory access pattern.
Even still, I disable 5-level page tables anyway. I mean, really, why allow an extra level of MMU page walk indirection just for the heck of it? If you’re giving me the option, I’m gonna take the shorter route!
But still, I was curious to measure its impact in more typical application workloads (low latency trading is an outlier). So I leaned on some industry benchmark packages for experimentation.
How Do We Select Pertinent Benchmarks?
I don’t have access to a machine with gobs of RAM. But what I *do* have is insight into other uses which page tables serve. For example, one is page faulting – the kernel must traverse the page tables to accomplish this task. I’d say page faulting is a pretty common and significant task, wouldn’t you?
With that goal in mind, I used LmBench’s lat_pagefault1numactl –membind=1 –cpunodebind=1 ~/lmbench/bin/x86_64-linux-gnu/lat_pagefault -N 100 /tmp/bigfile for single-threaded minor fault measurements, and ebizzy2numactl –membind=1 –cpunodebind=1 ~/utils/benchmark/ebizzy-0.3/ebizzy -m -l -p -t 7 -n 7 -S 10 for multi-threaded experimentation. All tests were run on an Ice Lake CPU system running Rocky Linux 8.5, using two (2) different forms of CPU isolation for each test: isolcpus for lat_pagefault and the systemd CPUAffinity setting in /etc/systemd/system.conf for ebizzy. A fresh reboot precedes every test. Each test executes 30 times with the mean and 95% Confidence Interval (CI) calculated from the runtimes. I use arithmetic mean for lat_pagefault since it reports duration (μs). And I use harmonic mean for ebizzy since it reports throughput (records per second).
Single-threaded Benchmarking
Using the same 12MB file, I measured the time it took to fault in pages to a process’s address space using lat_pagefault and processed the results with R.
[mdawson@eltoro]# Rscript -e 'library(lsr); n <- as.numeric (readLines ("stdin")); mean(n); ciMean(n)' < /tmp/4lvl-pgtbl.minflt.txt
[1] 0.1056367
       2.5%     97.5%
n 0.1055758 0.1056975

[mdawson@eltoro]# Rscript -e 'library(lsr); n <- as.numeric (readLines ("stdin")); mean(n); ciMean(n)' < /tmp/5lvl-pgtbl.minflt.txt
[1] 0.10588
       2.5%     97.5%
n 0.1058097 0.1059503

[mdawson@eltoro]# Rscript -e 'lvl4 <- as.numeric (readLines ("/tmp/4lvl-pgtbl.minflt.txt")); lvl5 <- as.numeric (readLines ("/tmp/5lvl-pgtbl.minflt.txt")); t.test(lvl4, lvl5, var.equal = TRUE);'

        Two Sample t-test

data:  lvl4 and lvl5
t = -5.3531, df = 58, p-value = 1.543e-06
alternative hypothesis: true difference in means is not equal to 0
95 percent confidence interval:
 -0.0003343242 -0.0001523425
sample estimates:
mean of x mean of y
0.1056367 0.1058800
The average page fault latency is 105.637ns (105.576 – 105.698 CI 95%) for 4-level page tables and 105.88ns (105.81 – 105.95 CI 95%) for 5-level page tables. That’s a statistically significant difference based on the highlighted sample t-test p-value (<< 0.05).
So, we’ve discovered that 5-level page tables *do* add overhead to minor page faults. But it sure doesn’t seem like a whole lot, does it? How does it all add up when faulting in a multithreaded app?
Multithreaded Benchmarking
I’ve chosen the widely used ebizzy benchmark for our multithreaded page fault experiment. Here’s how the benchmark is explained in its source code header:
This program is designed to replicate a common web search app workload. A lot of search applications have the basic pattern: Get a request to find a certain record, index into the chunk of memory that contains it, copy it into another chunk, then look it up via binary search. The interesting parts of this workload are:
- Large working set
- Data alloc/copy/free cycle
- Unpredictable data access patterns
I ran seven (7) distinct test iterations, each with an additional thread up to a max of 7 simultaneous threads. While the search pattern within a given run is indeed random, each run utilizes the same seed for apples-to-apples comparison.
Ebizzy Throughput Comparison
Throughput numbers starting from only one (1) thread up to three (3) threads look roughly similar. So I’ve zoomed in on results from four (4) threads and up:
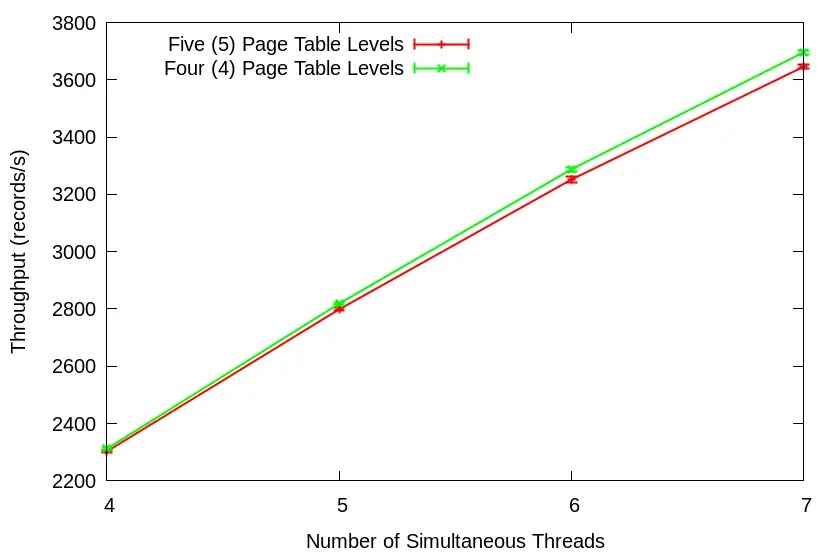
Notice the increasing margin in throughput between the two as the number of threads increases. But how can we be certain that this is due to page fault overhead? I ran a separate set of tests with the repetitive munmap() calls taken out of the main thread loop. Note the identical throughput in this scenario:
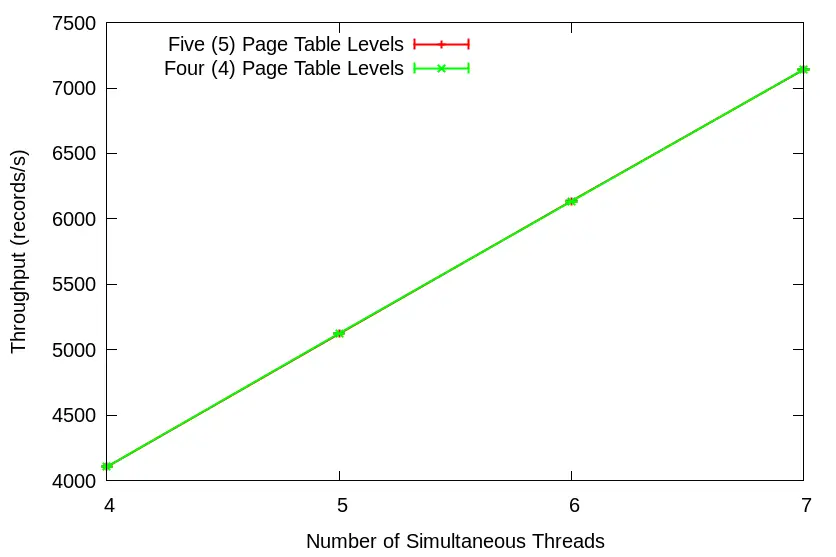
The fault, dear Brutus, lies in our minor page faults. And the overhead becomes more pronounced with each additional thread. Let’s put on our Active Benchmarking caps to see what’s causing all this commotion.
5-level Page Table Overhead Illustrated
Let’s fire up “perf record” for both ebizzy runs and see what a subsequent “perf diff” reveals. For both 4-level and 5-level page tables, I profiled the four (4) thread test since this is where we first notice the throughput divergence:
[mdawson@eltoro]# perf diff 4level-pgtable.perf.data 5level-pgtable.perf.data
# Event 'cycles:ppp'
#
# Baseline  Delta Abs  Shared Object       Symbol
# ........  .........  ..................  ..................................
#
     1.16%     -0.32%  [kernel.kallsyms]   [k] cgroup_throttle_swaprate
     4.43%     +0.27%  [kernel.kallsyms]   [k] _raw_spin_lock
     1.39%     +0.10%  [kernel.kallsyms]   [k] down_read_trylock
    64.15%     -0.09%  ebizzy              [.] thread_run
     3.81%     +0.06%  [kernel.kallsyms]   [k] sync_regs
               +0.05%  [kernel.kallsyms]   [k] p4d_offset.part.18
     0.91%     -0.03%  [kernel.kallsyms]   [k] up_read
     2.73%     +0.03%  [kernel.kallsyms]   [k] get_page_from_freelist
     1.65%     -0.03%  [kernel.kallsyms]   [k] __list_del_entry_valid
     0.31%     +0.03%  [kernel.kallsyms]   [k] alloc_pages_vma
     0.78%     -0.02%  [kernel.kallsyms]   [k] native_queued_spin_lock_slowpath
     3.09%     -0.02%  [kernel.kallsyms]   [k] native_irq_return_iret
     0.55%     +0.02%  [kernel.kallsyms]   [k] unmap_page_range
     0.46%     -0.02%  [kernel.kallsyms]   [k] __list_add_valid
     0.54%     -0.02%  [kernel.kallsyms]   [k] __mod_node_page_state
     0.90%     +0.02%  [kernel.kallsyms]   [k] free_pcppages_bulk
     0.36%     +0.01%  [kernel.kallsyms]   [k] __alloc_pages_nodemask
First things first: do you notice a function call in one of the runs that doesn’t appear in the other? Yep! Kernel function p4d_offset.part.18 takes up cycles only in 5-level page table mode. Do you remember from earlier sections why that might be? From Fig. 2 above, we see that the P4D page is added for 5-level page tables, so this makes perfect sense.
The other difference we note from “perf diff” is the extra time spent in spinlocks, _raw_spin_lock, for 5-level page tables. This, also, is due to the extra upper-level directory. Updates at each level of the page table is protected by spinlocks. However, at the PMD and PTE levels these work at page granularity. On the other hand, spinlocks for updates at the uppermost levels lock the entire page table. It’s understandable, then, how an extra page table level at such lock coarseness would interfere with page fault scalability.
SIDE NOTE: Notice the overhead imposed by the *completely* unnecessary cgroup_throttle_swaprate function for both 4-level and 5-level page tables? Every page fault incurs that overhead even if you include “cgroup_disable=memory” in your kernel boot parameter list! Another in a long list of reasons to avoid runtime page faults in your latency-sensitive applications. But on the bright side, it looks like there’s a patch in the works to address this issue.
Shall we round out our benchmarking session with a direct measurement of page fault latency with our friend, eBPF? Let’s start with a snapshot from the 4-level page table ebizzy test using four (4) threads:
[root@eltoro]# /usr/share/bcc/tools/funclatency handle_mm_fault
Tracing 1 functions for "handle_mm_fault"... Hit Ctrl-C to end.

     nsecs               : count     distribution
         0 -> 1          : 0        |                                        |
         2 -> 3          : 0        |                                        |
         4 -> 7          : 0        |                                        |
         8 -> 15         : 0        |                                        |
        16 -> 31         : 0        |                                        |
        32 -> 63         : 0        |                                        |
        64 -> 127        : 0        |                                        |
       128 -> 255        : 82       |                                        |
       256 -> 511        : 95337189 |****************************************|
       512 -> 1023       : 84564013 |***********************************     |
      1024 -> 2047       : 17892326 |*******                                 |
      2048 -> 4095       : 785823   |                                        |
      4096 -> 8191       : 29906    |                                        |
      8192 -> 16383      : 25789    |                                        |
     16384 -> 32767      : 1784     |                                        |
     32768 -> 65535      : 0        |                                        |
     65536 -> 131071     : 1        |                                        |
    131072 -> 262143     : 2        |                                        |

avg = 630 nsecs, total: 125302193687 nsecs, count: 198690342
Now observe the distributional difference of the same test using 5-level page tables:
[root@eltoro]# /usr/share/bcc/tools/funclatency handle_mm_fault
Tracing 1 functions for "handle_mm_fault"... Hit Ctrl-C to end.

     nsecs               : count     distribution
         0 -> 1          : 0        |                                        |
         2 -> 3          : 0        |                                        |
         4 -> 7          : 0        |                                        |
         8 -> 15         : 0        |                                        |
        16 -> 31         : 0        |                                        |
        32 -> 63         : 0        |                                        |
        64 -> 127        : 0        |                                        |
       128 -> 255        : 81       |                                        |
       256 -> 511        : 81011474 |*********************************       |
       512 -> 1023       : 95799968 |****************************************|
      1024 -> 2047       : 17652916 |*******                                 |
      2048 -> 4095       : 751147   |                                        |
      4096 -> 8191       : 23601    |                                        |
      8192 -> 16383      : 20151    |                                        |
     16384 -> 32767      : 593      |                                        |
     32768 -> 65535      : 0        |                                        |
     65536 -> 131071     : 0        |                                        |
    131072 -> 262143     : 3        |                                        |

avg = 640 nsecs, total: 125164828170 nsecs, count: 195275209
Notice the mode difference between them. Page fault latency primarily clusters within the 256 -> 511ns bucket for 4-level, but within the 512 -> 1023ns bucket for 5-level. Our experimentation demonstrates that the extra P4D level, coupled with its associated spinlock overhead, contributes to this latency shift.
Of course, we could perform MUCH more testing for a fuller grasp of 5-level page table impact. Page faulting, after all, isn’t the only instance during which the kernel walks the page table. Then, of course, there’s the MMU page walkers themselves. We could track differences in the dtlb_(load|store)_misses.walk_active PMU metrics between both page table modes for that. But as a wise person once said, “Ain’t nobody got time for that!”. So, I’ll leave the rest as an exercise for the reader.
NOTE: For an in-depth discussion on using perf for profiling and reading hardware PMU counters for application performance analysis, check out our book Performance Analysis and Tuning on Modern CPUs.3Paid affiliate link
Always Read the Fine Print
I could’ve avoided double-tipping if only I’d read the check before paying the bill. I could’ve clicked Do Not Accept on the search engine switch during that software installation if I’d read the whole agreement. And I could’ve clicked Do Not Subscribe after that online retailer purchase if only I’d read the entire Order page. Doing so would’ve spared me the hit to my pocket, my search result quality, and my INBOX.
Likewise, keeping abreast of upcoming changes with your chosen Linux distribution can spare you performance regression headaches at each upgrade cycle (remember the “numa_balancing” headache after upgrading from RHEL 6 to RHEL 7?). Based on the aforementioned, you just might wanna click the Do Not Enable dial box on 5-level page tables. Especially if you run multithreaded applications in performance-sensitive environments. And, for cryin’ out loud, avoid runtime page faults in latency-sensitive environments as much as humanly possible!
- 1numactl –membind=1 –cpunodebind=1 ~/lmbench/bin/x86_64-linux-gnu/lat_pagefault -N 100 /tmp/bigfile
- 2numactl –membind=1 –cpunodebind=1 ~/utils/benchmark/ebizzy-0.3/ebizzy -m -l -p -t 7 -n 7 -S 10
- 3Paid affiliate link
