Estimated reading time: 9 minutes
Sometimes, we run on autopilot when configuring CPU Affinity, turning over complete control to our intuition. It happens just as easily in everyday life, too. For example, while planning a vacation, a man buys adjacent airline seats for his family of four. He selects seats 3A, 3B, 3E, and 3F. “I got us the entire third row! Sweet!” Until he realizes too late that the more adjacent seating actually includes 3A, 3B, *4A* and *4B*.

Then he notices that the connecting domestic flight at O’Hare will be at Gate H3. . . but they land at Gate K3! Sure, both gates are in the same terminal (Terminal 3), but they’re still in different concourses. He and his wife must race the kids & luggage from Concourse K all the way to Concourse H. But then as soon as they exit the plane to begin their track meet, he looks up to discover that Gate H3 is directly across from Gate K3. Crisis averted.

Intuitively, this guy imagined that choosing sequential seating within the same row gave him the best proximity. Then he figured an airport gate in Concourse H would be far from one in Concourse K. But his intuition failed him on both counts. Had he paid closer attention to the actual seating and terminal maps, he could’ve avoided this confusion.
The same is true with CPU Affinity. Everyone understands the benefits of CPU Affinity on NUMA systems. After all, who wants to endure cross-socket latency for CPU <=> RAM communication? But we’ve also become increasingly aware of nonuniformity on even *single* sockets, as evidenced by the recent proliferation of core-to-core latency measurement tools. Yet, how do many go about pinning application threads to cores? “Hmm, I’ll put this thread on core 1, this one on 2, and the last one on 3. Good, now they’re running as close together as possible.” Meanwhile, you pin the low priority threads faaaar away on core 23. That’s CPU Affinity on autopilot.
QUESTION: How much performance do we lose by configuring CPU Affinity for our multithreaded applications on autopilot?
Table of contents
What Is CPU Affinity?
Firs things first – what exactly is CPU Affinity? It’s a technique that allows a user to assign (or pin) a process or thread to a specific compute resource or group of compute resources. By default, the OS schedules processes among all available cores using sophisticated heuristics to ensure a fair distribution of runtime. Employing CPU Affinity circumvents this scheduling decision process by pinning selected threads to a designated list of cores.
Benefits of CPU Affinity
Fairness is cool for general purpose computer usage. But when we want optimal performance, we don’t need the OS suddenly snatching our thread off its core only to later reschedule it on a completely different core, ruining any chance it had at achieving effective cache utilization. No, we don’t want fairness. We don’t want to wait in-line at the club. We want the bouncer to wave us to the front and walk us to our usual VIP table with our designated waitress. That’s right – no arbitrary switching of waitresses so that we’re forced to repeat our favorite drink order to rotating wait-staff all night.
That’s the benefit of CPU Affinity. No long run queue times. No thrashing of core caches due to rescheduling, forcing us to revisit LLC or RAM more often than necessary.
When it comes to multithreaded applications, we can ensure low latency inter-thread communication when we pin threads to adjacent cores. But how much lower could that latency go if we truly understood core adjacency on modern CPUs?
Microarchitectural Evolution
The days of the monolithic die are numbered. Enter the era of the chiplet, where smaller dies comprising a subset of cores and cache interconnect with other such dies on a single CPU. Oh sure, Intel held out for as long as it could. But with the slowing of Moore’s Law and the breakdown in Dennard Scaling, Intel finally capitulated with the adoption of Embedded Multi-Die Interconnect Bridge (EMIB) interconnect technology for the higher core count Sapphire Rapids variants. AMD joined the chiplet movement much earlier with its Infinity Fabric interconnect via which multiple Core Complex Dies (CCDs), each housing one or more Core Complexes (CCXs), communicate through an IO Die (IOD).
Heck, there’s even the recent Universal Chiplet Interconnect Express (UCIe) open specification for chiplet interconnect to which Intel, AMD, ARM, and several others belong. Yep, you read that right – a standard that paves the way to mix & match plug-and-play chiplets!
This chiplet momentum brings the latency implications of multi-socket NUMA systems down to the level of a single socket. Why? Because the chiplets on modern CPUs are essentially sockets unto themselves, with AMD’s Infinity Fabric and Intel’s EMIB standing in as the inter-socket connection (e.g., HyperTransport or UPI).
So, how should this affect how we perform CPU Affinity?
Microarchitecture Effects on CPU Affinity
Naturally, the cores that reside within the same chiplet exhibit lower communication latency than that between cores in disparate chiplets. Pick up any one of the several available core-to-core latency measurement tools and run it on your own CPU for proof.
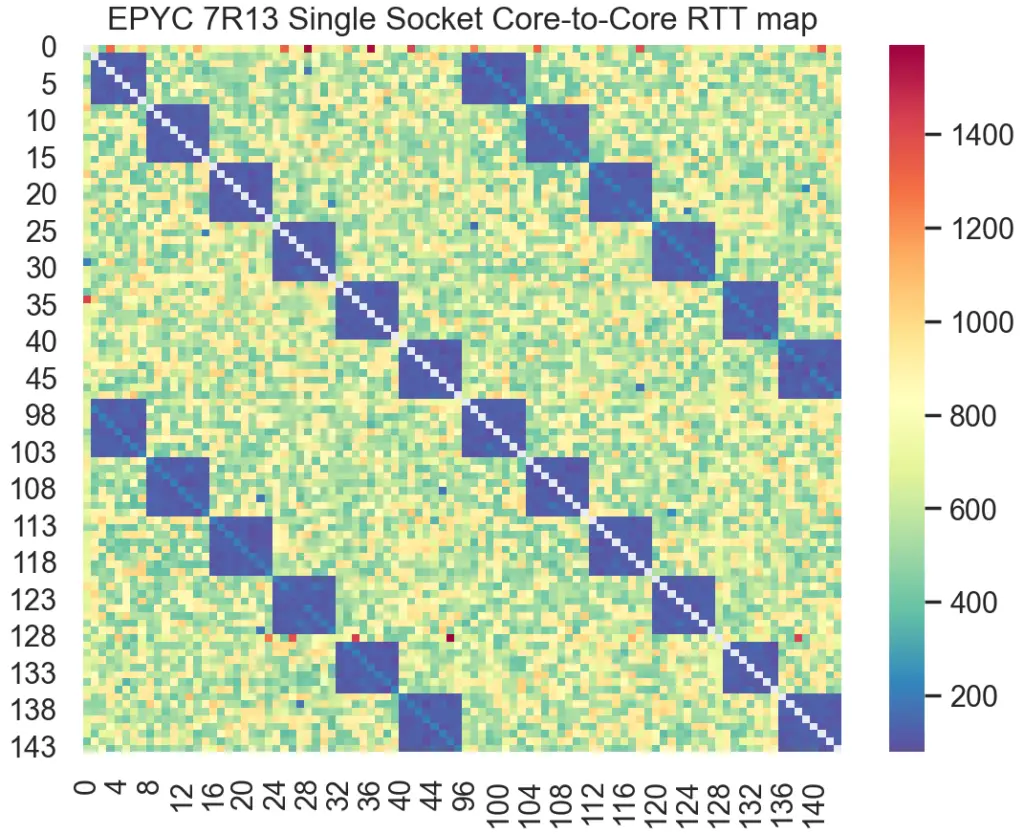
For example, here’s the latency heatmap produced from one such tool on AMD’s Milan. Notice the deep blue blocks clearly highlighting the lowest latency for cores within the same CCD:
Here’s another heatmap from the same tool used on Intel’s Sapphire Rapids:
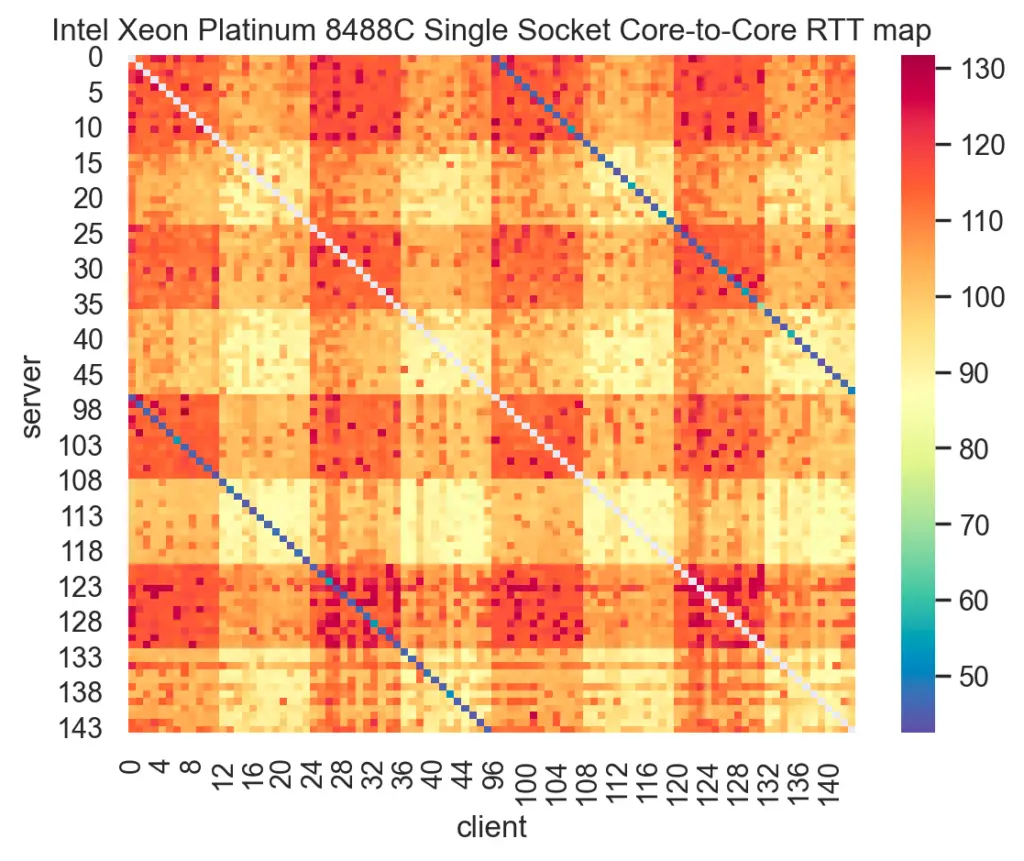
Notice the wide range in inter-core communication latency across a single socket for both Milan and Sapphire Rapids. Now, think back to a time when you pinned threads to cores on the same socket, each core number selected sequentially, confident that this sufficed to indicate location. How much performance did you leave on the table doing that?
And this is not just some recent phenomenon, by the way. Such CPU nonuniformity actually predates this chiplet era. For example, take a look at this latency heatmap from an Intel Cascade Lake, taken using a different core-to-core latency measurement tool:
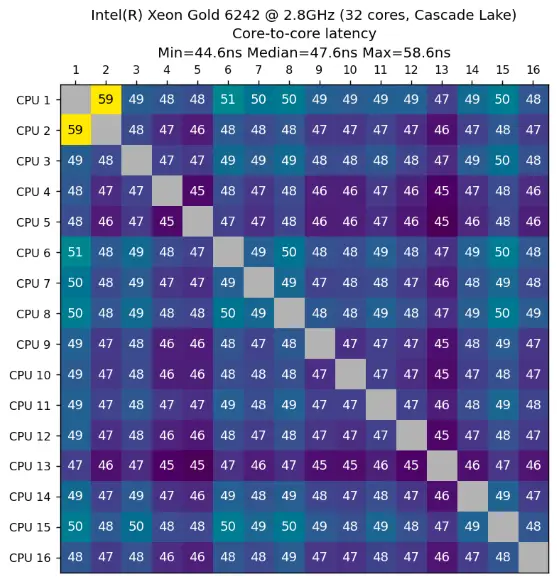
Cascade Lake uses a *monolithic* die. Yet, notice the spread in inter-core latency – a minimum of 44.6ns and a maximum of 58.6ns. That’s a 14ns spread on a single die comprising only 16 cores. Now extrapolate that to a chiplet-based CPU with a factor of 3x or more cores! That really adds up over the total runtime of a multithreaded application.
But how much does it add up to, really? Let’s test it out.
NOTE: For an in-depth discussion on CPU microarchitecture and squeezing the most performance from it, check out our book Performance Analysis and Tuning on Modern CPUs.1Paid affiliate link
Demo
Our demo uses an Intel Sapphire Rapids-based system comprising 16 cores running Rocky 8.6. We isolate all cores of the 2nd socket (all odd-numbered cores) from the kernel scheduler using the isolcpus boot parameter to minimize interference:
[mdawson@eltoro ~]$ lscpu
Architecture:        x86_64
CPU op-mode(s):      32-bit, 64-bit
Byte Order:          Little Endian
CPU(s):              32
On-line CPU(s) list: 0-31
Thread(s) per core:  1
Core(s) per socket:  16
Socket(s):           2
NUMA node(s):        2
Vendor ID:           GenuineIntel
CPU family:          6
Model:               143
Model name:          Intel(R) Xeon(R) Gold 6444Y
Stepping:            8
CPU MHz:             4000.000
BogoMIPS:            7200.00
L1d cache:           48K
L1i cache:           32K
L2 cache:            2048K
L3 cache:            46080K
NUMA node0 CPU(s):   0,2,4,6,8,10,12,14,16,18,20,22,24,26,28,30
NUMA node1 CPU(s): 1,3,5,7,9,11,13,15,17,19,21,23,25,27,29,31We’ll use our own adaptation of Martin Thompson’s InterThreadLatency code to benchmark transfer rate between a thread pair while varying only its CPU affinity. Our version of the benchmark is called simply ping-pong.
The test exchanges two messages serially, each one updated by only one of the threads, for a fixed number of iterations. The output is a transfer rate in “op/sec”, and we take the harmonic mean of 30 samples for each affinity scenario. Since we practice “Active Benchmarking” here at JabPerf, we will run each scenario under perf stat -d to obtain metrics during execution; otherwise, we’re just as negligent as those other clickbait benchmark articles.
#include <time.h>
#include <pthread.h>
#include <stdio.h>
#include <stdlib.h>
#include <stdint.h>
#include <sched.h>
#include <unistd.h>

const uint64_t ITERATIONS = 500LL * 1000LL * 1000LL;

volatile uint64_t s1 = 0;
volatile uint64_t s2 = 0;

void* run(void*)
{
    register uint64_t value = s2;
    while (true)
    {
        while (value == s1)
        {
            // busy spin
        }
        value = __sync_add_and_fetch(&s2, 1);
    }
}

int main (int argc, char *argv[])
{
    if(argc < 3)
    {
        puts("Please specify the server and client core numbers");
        return(-1);
    }

    auto server_core = atoi(argv[1]);
    auto client_core = atoi(argv[2]);

    cpu_set_t cpu_set_server, cpu_set_client;
    CPU_ZERO(&cpu_set_server);
    CPU_ZERO(&cpu_set_client);
    CPU_SET(server_core, &cpu_set_server);
    CPU_SET(client_core, &cpu_set_client);

    sched_setaffinity(getpid(), sizeof(cpu_set_server), &cpu_set_server);

    pthread_t thread;
    pthread_create(&thread, NULL, run, NULL);
    pthread_setaffinity_np(thread, sizeof(cpu_set_client), &cpu_set_client);

    timespec ts_start;
    timespec ts_finish;
    clock_gettime(CLOCK_MONOTONIC, &ts_start);

    register uint64_t value = s1;
    while (s1 < ITERATIONS)
    {
        while (s2 ! = value)
        {
            // busy spin
        }
        value = __sync_add_and_fetch(&s1, 1);
    }

    clock_gettime(CLOCK_MONOTONIC, &ts_finish);

    uint64_t start = (ts_start.tv_sec * 1000000000LL) + ts_start.tv_nsec;
    uint64_t finish = (ts_finish.tv_sec * 1000000000LL) + ts_finish.tv_nsec;
    uint64_t duration = finish - start;

    printf("duration = %lldn", duration);
    printf("ns per op = %lldn", (duration / (ITERATIONS * 2)));
    printf("op/sec = %lldn",
        ((ITERATIONS * 2L * 1000L * 1000L * 1000L) / duration));
    printf("s1 = %lld, s2 = %lldn", s1, s2);

    return 0;
}Without further ado, let’s start the show!
CPU Affinity: Cores 1 and 3
The first affinity test represents the “autopilot” method, wherein sequential core numbering provides “enough” intuitive evidence of proximity:
[mdawson@eltoro ~]$ perf stat -d -r 30 ./ping-pong 1 3 --post sleep 5

 Performance counter stats for './ping-pong 1 3 --post sleep 5' (30 runs):

        123,347.69 msec task-clock                #    1.915 CPUs utilized            ( +-  1.32% )
                 3      context-switches          #    0.023 /sec                     ( +-  3.43% )
                 2      cpu-migrations            #    0.016 /sec
               114      page-faults               #    0.885 /sec
   492,329,584,771      cycles                    #    3.821 GHz                      ( +-  1.32% )
   116,256,410,619      instructions              #    0.23  insn per cycle           ( +-  1.16% )
    37,756,258,410      branches                  #  293.023 M/sec                    ( +-  1.19% )
     1,140,381,441      branch-misses             #    3.02% of all branches          ( +-  0.61% )
 2,953,977,508,626      slots                     #   22.926 G/sec                    ( +-  1.32% )
    98,465,578,134      topdown-retiring          #      3.1% retiring                ( +-  1.15% )
   295,398,315,560      topdown-bad-spec          #      9.6% bad speculation         ( +-  0.52% )
   648,716,629,344      topdown-fe-bound          #     20.9% frontend bound          ( +-  0.31% )
 1,922,981,211,108      topdown-be-bound          #     66.4% backend bound           ( +-  1.98% )
    17,376,451,225      topdown-heavy-ops         #      0.5% heavy operations       #      2.6% light operations        ( +-  2.44% )
   214,308,511,013      topdown-br-mispredict     #      7.0% branch mispredict      #      2.6% machine clears          ( +-  0.73% )
   115,842,706,999      topdown-fetch-lat         #      3.6% fetch latency          #     17.3% fetch bandwidth         ( +-  1.01% )
 1,755,009,602,189      topdown-mem-bound         #     61.1% memory bound           #      5.4% Core bound              ( +-  2.10% )
    38,749,344,790      L1-dcache-loads           #  300.730 M/sec                    ( +-  1.16% )
     1,093,477,009      L1-dcache-load-misses     #    2.82% of all L1-dcache accesses  ( +-  1.63% )
     1,093,453,003      LLC-loads                 #    8.486 M/sec                    ( +-  1.63% )
             2,259      LLC-load-misses           #    0.00% of all LL-cache accesses  ( +-  4.87% )

64.427 +- 0.815 seconds time elapsed ( +- 1.27% )CPU Affinity: Cores 3 and 17
The second affinity test represents a more deliberate method of CPU Affinity, using information from a core-to-core latency measurement tool as the basis for selecting adjacent cores:
[mdawson@eltoro ~]$ perf stat -d -r 30 ./ping-pong 3 17 --post sleep 5

 Performance counter stats for './ping-pong 3 17 --post sleep 5' (30 runs):

        115,453.25 msec task-clock                #    1.922 CPUs utilized            ( +-  1.14% )
                 3      context-switches          #    0.025 /sec                     ( +-  3.48% )
                 2      cpu-migrations            #    0.017 /sec
               114      page-faults               #    0.949 /sec
   460,816,877,399      cycles                    #    3.835 GHz                      ( +-  1.14% )
   116,594,571,811      instructions              #    0.24  insn per cycle           ( +-  1.61% )
    37,866,504,741      branches                  #  315.152 M/sec                    ( +-  1.65% )
     1,152,422,965      branch-misses             #    3.18% of all branches          ( +-  0.59% )
 2,764,901,264,394      slots                     #   23.011 G/sec                    ( +-  1.14% )
    97,584,784,218      topdown-retiring          #      3.2% retiring                ( +-  1.22% )
   287,332,834,357      topdown-bad-spec          #      9.9% bad speculation         ( +-  0.58% )
   628,879,520,128      topdown-fe-bound          #     21.7% frontend bound          ( +-  0.62% )
 1,756,525,509,143      topdown-be-bound          #     65.1% backend bound           ( +-  1.55% )
    16,264,116,656      topdown-heavy-ops         #      0.6% heavy operations       #      2.6% light operations        ( +-  2.50% )
   216,854,967,417      topdown-br-mispredict     #      7.2% branch mispredict      #      2.7% machine clears          ( +-  0.55% )
   108,427,466,853      topdown-fetch-lat         #      3.8% fetch latency          #     18.0% fetch bandwidth         ( +-  0.85% )
 1,604,727,042,064      topdown-mem-bound         #     59.7% memory bound           #      5.4% Core bound              ( +-  1.64% )
    38,863,301,146      L1-dcache-loads           #  323.448 M/sec                    ( +-  1.61% )
     1,075,108,857      L1-dcache-load-misses     #    2.89% of all L1-dcache accesses  ( +-  0.98% )
     1,075,084,908      LLC-loads                 #    8.948 M/sec                    ( +-  0.98% )
             1,995      LLC-load-misses           #    0.00% of all LL-cache accesses  ( +-  4.21% )

60.078 +- 0.660 seconds time elapsed ( +- 1.10% )Results Analysis
As we’d expect, most of the CPU metrics roughly match since it’s the exact same code. However, notice the far fewer cycles and slightly higher IPC for the 3 <=> 17 affinity config vs. that of the 1 <=> 3 config. Not only that, but the L1d throughput rate is ~23MB/s higher, as well. When cores wait less time for memory transfers, they can get back to work more quickly.
“But how can this be when cores 1 and 3 are so close together, while core 17 is waaay over there?” It’s because our intuition about sequential core numbering hinders us from employing effective CPU Affinity.
How does all this translate into ping-pong transfer rates?
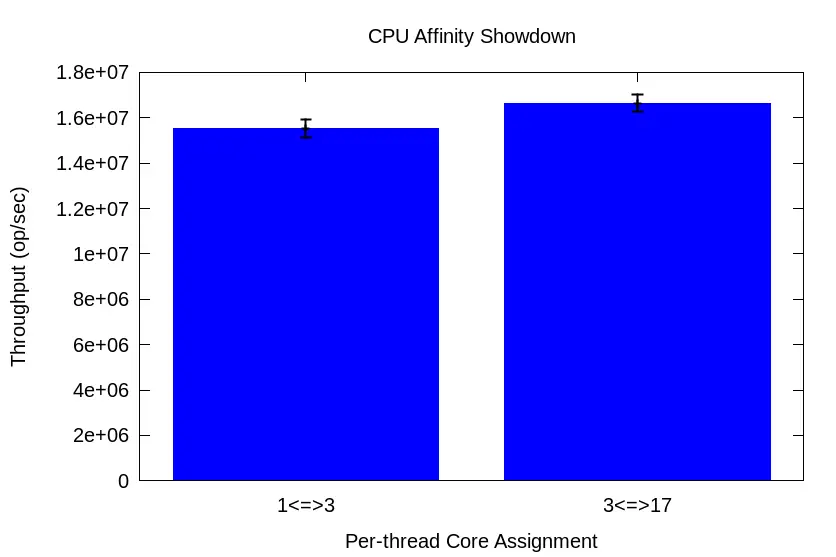
Across 30 runs, harmonic mean transfer rate for the 1<=>3 test is 15,521,920 op/sec with a 95% CI of 15,130,333 to 15,934,314. But for the 3<=>17 test, the harmonic mean transfer rate is 16,645,518 op/sec with a *narrower* 95% CI of 16,279,917 to 17,027,917. That’s a 7% boost in throughput w/o a single code change! That’s the kind of boost you’d expect after dealing with the multiple compilations and representative workload maintenance necessary for profile-guided optimization (PGO)!
And remember, this is a monolithic 16-core CPU. How much wider of a performance disparity would we discover across core pairs on a 40-, 60-, or 90-core chiplet-based CPU?
New Year’s Resolution: Thoughtful CPU Affinity
Let’s face it. If you truly care about low latency and/or high throughput, there’s a standard list of things you’re gonna do. Among them will include:
- Side-stepping the OS scheduler with CPU Affinity for a thread-per-core configuration
- Avoiding direct data sharing and the synchronization overhead (i.e., locking) it requires by utilizing message-passing between application threads
If this describes you, then it behooves you to pay closer attention to the way you pin threads to cores. I’ve observed 5 – 10% performance improvements in real-world applications, and I wouldn’t be surprised to find even greater improvements on higher core count CPUs.
Make it your 2024 New Year’s Resolution. And believe me, this will require MUCH less work and FAR less time commitment than your other resolution (and you know good & well which resolution of yours I’m talkin’ about).
- 1Paid affiliate link

One Response