
Estimated reading time: 8 minutes
I remember when Big Tech focused all their recruitment efforts at prestigious engineering colleges and universities. They’ve since evolved to be more inclusive, casting a wider net that encompasses places like HBCUs and Code Bootcamps. Corporations traditionally reserved “Openness to Feedback” for only execs or upwardly mobile hotshot employees. But nowadays, companies boast of flat management structures and tout an “open door policy”, inclusive of all employee levels, as a major selling point. Such efforts toward inclusivity generally improve reputation and produce positive outcomes. On the other hand, if the CPU you select for your latency-sensitive application contains an inclusive Last Level Cache, then you got problems, buddy!
And you’ll find these CPUs in the wild even today. All the major cloud vendors still offer them as options. Heck, you may even have a few reliably chuggin’ along in your own datacenter.
But what exactly does it mean for a Last Level Cache to be “inclusive”? And what problem does it pose for latency-sensitive apps? Read on to find out. And don’t worry – I *will* provide a demo.
Table of contents
Last Level Cache: Final Stop Before Main Memory
I’ve written previously about the “Memory Wall” stemming from a widening CPU <=> Main Memory performance gap. Among the steps taken by chip designers to mitigate the issue is the placement of smaller, faster pockets of SRAM nearer the CPU (illustrated below):
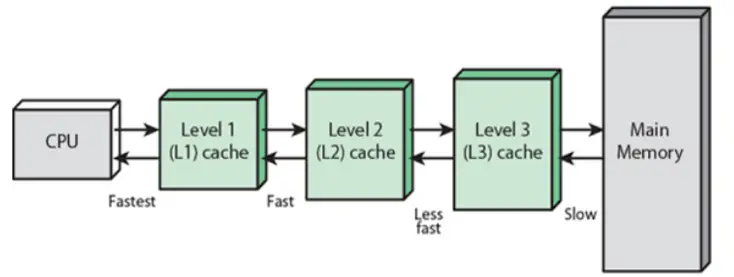
Level 3 (L3) represents the Last Level Cache (LLC) in the example above, and is the last (and slowest) stop within the cache hierarchy before the system must endure the long trek out to Main Memory. Among LLC design choices is the “inclusion policy” – i.e., whether or not the contents of the smaller caches shall be a subset of the LLC.
NOTE: For an in-depth discussion on CPU microarchitecture and squeezing the most performance from it, check out our book Performance Analysis and Tuning on Modern CPUs.1Paid affiliate link
Inclusion Policy
LLC inclusion policy falls into three camps: inclusive, exclusive, and non-inclusive. If all cache blocks of the smaller caches must also reside in the LLC, then that LLC is “inclusive”. If the LLC only contains blocks which are *not* present in the smaller caches, then that LLC is “exclusive”. And finally, if the LLC is neither strictly inclusive nor exclusive of the smaller caches, it is labeled “non-inclusive”.
Benefits of an inclusive LLC include greatly simplified cache coherency since less traffic must traverse all levels of the cache hierarchy to achieve its aim. Simply put, when the LLC contains all blocks from all levels of the cache hierarchy, it becomes the “one stop shop” for coherency info. However, one of the drawbacks is wasted capacity. As a matter of fact, a long held belief pinpointed squandered memory as the main drawback of an inclusive policy. But its true disadvantage is a more insidious side-effect – “backward invalidations”.
Inclusive LLC & Backward Invalidations
Recall that an inclusive policy dictates that all blocks of the smaller caches *must* also reside in the LLC. This means that any block evicted from the LLC must be evicted from the smaller caches to maintain compliance. This is referred to as a “backward invalidation”.
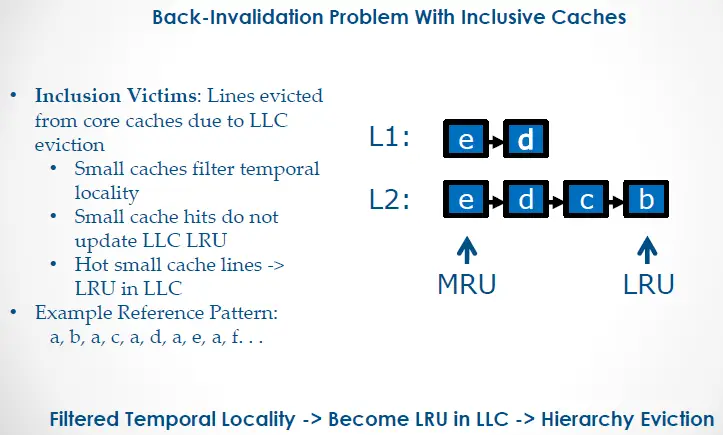
Imagine a hypothetical CPU as pictured above with the L2 designated as its inclusive LLC. Letters ‘a’ thru ‘e’ depict cache blocks in the cache hierarchy. If the CPU core references blocks in the pattern depicted (a -> b -> a -> c -> a -> d and so forth), the LLC will fill up with each of these blocks until the core requests block ‘e’. The LLC reaches max capacity at that point, and so must evict another block based on its LRU history table. The inclusion victim would be block ‘a’ despite the fact that this block remains at the MRU end of the L1’s history table. In compliance with inclusion policy, the L1 evicts block ‘a’, as well. Imagine the performance hit incurred from this repeated L1 eviction of hot cache block ‘a’!
Filtered temporal information between the L1 and LLC forms the crux of the issue. The LLC only knows about compulsory cache miss events across all levels, but not about cache hit updates for those blocks. Mitigating this issue, therefore, requires opening that channel of communication back to the LLC. Intel attempted at least two different solutions to this issue: Temporal Locality Hints (TLH) and Query Based Selection (QBS).
Temporal Locality Hints
TLH conveys temporal info about hot L1 cache blocks back to the LLC. This makes it far less likely for the LLC to choose those blocks for eviction. The drawback, however, is all that extra bandwidth required between the L1 and LLC. In fact, this feature was once configurable as a BIOS option on CPUs as recent as Westmere. It was called “Data Reuse Optimization”:
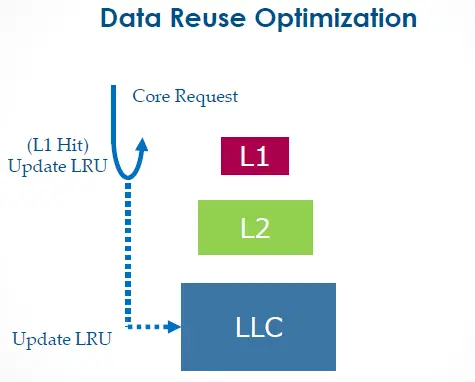
However, that BIOS option disappeared on subsequent CPU releases. Is this because Intel replaced TLH with something else? Or did they just remove it as a configuration option? I don’t know. Worse still, I have no Westmere system on which to perform a demo for you. Sorry, guys.
Query Based Selection
Each year, I’d get invited to the Intel HPC Roundtable where we’d discuss microarchitectural details of upcoming chip releases. These intimate workshops with Intel Fellows and Distinguished Engineers facilitated the kind of deep dives and Q&As that weren’t possible on public forums.
Here’s what I scribbled in my notes from one of the speakers on the subject of the upcoming Broadwell server CPU release at Intel HPC Roundtable 2015:
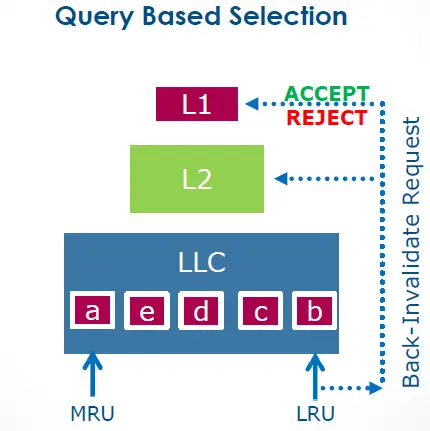
“posted interrupts, page modification logging, cache QoS enforcement, memory BW monitoring, HW-controlled power mgmt., improved page miss handling/page table walking, Query Based Selection (L3 won’t evict before querying core)“
And that’s exactly how QBS works – before selecting a block as an inclusion victim, it first queries the L1 for approval:
I flew back home to Chicago excited and eager to get my hands on the pre-release Broadwell evaluation CPU for testing.2Lots of HFT firms are on Early Release Programs with chip manufacturers to test CPUs prior to GA release. But my benchmark results left me scratching my head. Maybe QBS was not all it was touted to be. So, I reached out to Intel Engineering with my benchmark code and test results, only to hear back that they’d given up on QBS prior to release due to “unresolved issues.” Well, at least Intel came through with the “Cache QoS Enforcement” promise as a workaround.
Embracing Non-inclusive Last Level Caches
After Broadwell, Intel finally joined the AMD camp and adopted non-inclusive LLCs with the release of Skylake. This permitted them to reduce the LLC footprint while considerably boosting L2 size. But does it live up to billing? Let’s see!
Demo
Our demo includes two machines: one Haswell-based (inclusive LLC) and the other Cascade Lake-based (non-inclusive LLC). I’ll grab my favorite all-purpose benchmark tool, stress-ng, and use its ‘flip’ VM stressor as a stand-in for our “low latency application”. The LLC-hogging application will be played by the ‘read64’ VM stressor. We’ll conduct both tests on the 2nd socket of each machine (all odd-numbered cores) where all cores are isolated from the scheduler. We’ll use core 3 for ‘flip’ and core 7 for ‘read64’.
“That’s odd. Why would you skip core 1, the first core on the 2nd socket?” Oh, you know full well why I’m not using that core! Don’t play with me!
Haswell: Inclusive Last Level Cache
This Haswell system contains 32KB of L1d and 20MB of LLC as shown below:
[mdawson@haswell ~]$ lscpu
Architecture:          x86_64
CPU op-mode(s):        32-bit, 64-bit
Byte Order:            Little Endian
CPU(s):                16
On-line CPU(s) list:   0-15
Thread(s) per core:    1
Core(s) per socket:    8
Socket(s):             2
NUMA node(s):          2
Vendor ID:             GenuineIntel
CPU family:            6
Model:                 63
Model name:            Intel(R) Xeon(R) CPU E5-2667 v3 @ 3.20GHz
Stepping:              2
CPU MHz:               3199.738
BogoMIPS:              6403.88
Virtualization:        VT-x
L1d cache:             32K
L1i cache:             32K
L2 cache:              256K
L3 cache:              20480K
NUMA node0 CPU(s):     0,2,4,6,8,10,12,14
NUMA node1 CPU(s):     1,3,5,7,9,11,13,15
Let’s grab a baseline run of ‘flip’ on core 3 using a 32KB working set which neatly fits the L1d:
[mdawson@haswell ~]$ perf stat -r 5 -d numactl --membind=1 stress-ng --vm 1 --taskset 3 --vm-keep --vm-bytes 32k --vm-method flip --metrics-brief --timeout 15s
stress-ng: info:  [80547] dispatching hogs: 1 vm
stress-ng: info:  [80547] successful run completed in 15.00s
stress-ng: info:  [80547] stressor       bogo ops real time  usr time  sys time   bogo ops/s   bogo ops/s
stress-ng: info:  [80547]                           (secs)    (secs)    (secs)   (real time) (usr+sys time)
stress-ng: info:  [80547] vm              1052649     15.00     14.87      0.12     70175.86     70223.42
stress-ng: info:  [80568] dispatching hogs: 1 vm
stress-ng: info:  [80568] successful run completed in 15.00s
stress-ng: info:  [80568] stressor       bogo ops real time  usr time  sys time   bogo ops/s   bogo ops/s
stress-ng: info:  [80568]                           (secs)    (secs)    (secs)   (real time) (usr+sys time)
stress-ng: info:  [80568] vm              1051884     15.00     14.87      0.12     70124.85     70172.38
stress-ng: info:  [80584] dispatching hogs: 1 vm
stress-ng: info:  [80584] successful run completed in 15.00s
stress-ng: info:  [80584] stressor       bogo ops real time  usr time  sys time   bogo ops/s   bogo ops/s
stress-ng: info:  [80584]                           (secs)    (secs)    (secs)   (real time) (usr+sys time)
stress-ng: info:  [80584] vm              1052379     15.00     14.87      0.12     70157.86     70205.40
stress-ng: info:  [80601] dispatching hogs: 1 vm
stress-ng: info:  [80601] successful run completed in 15.00s
stress-ng: info:  [80601] stressor       bogo ops real time  usr time  sys time   bogo ops/s   bogo ops/s
stress-ng: info:  [80601]                           (secs)    (secs)    (secs)   (real time) (usr+sys time)
stress-ng: info:  [80601] vm              1052289     15.00     14.87      0.12     70151.86     70199.40
stress-ng: info:  [80618] dispatching hogs: 1 vm
stress-ng: info:  [80618] successful run completed in 15.00s
stress-ng: info:  [80618] stressor       bogo ops real time  usr time  sys time   bogo ops/s   bogo ops/s
stress-ng: info:  [80618]                           (secs)    (secs)    (secs)   (real time) (usr+sys time)
stress-ng: info:  [80618] vm              1052280     15.00     14.87      0.12     70151.25     70198.80

 Performance counter stats for 'numactl --membind=1 stress-ng --vm 1 --taskset 3 --vm-keep --vm-bytes 32k --vm-method flip --metrics-brief --timeout 15s' (5 runs):

         15,005.64 msec task-clock                #    1.000 CPUs utilized            ( +-  0.00% )
                14      context-switches          #    0.001 K/sec                    ( +-  2.71% )
                 0      cpu-migrations            #    0.000 K/sec
             1,704      page-faults               #    0.114 K/sec
    50,584,401,411      cycles                    #    3.371 GHz                      ( +-  0.01% )  (49.99%)
   181,359,934,141      instructions              #    3.59  insn per cycle           ( +-  0.01% )  (62.49%)
    17,583,120,821      branches                  # 1171.768 M/sec                    ( +-  0.01% )  (74.99%)
         2,244,595      branch-misses             #    0.01% of all branches          ( +-  0.76% )  (87.50%)
    44,492,963,211      L1-dcache-loads           # 2965.083 M/sec                    ( +-  0.01% )  (37.52%)
        61,653,565      L1-dcache-load-misses     #    0.14% of all L1-dcache hits    ( +-  0.85% )  (37.51%)
           254,253      LLC-loads                 #    0.017 M/sec                    ( +-  1.34% )  (37.50%)
           146,656      LLC-load-misses           #   57.68% of all LL-cache hits     ( +-  1.51% )  (37.48%)

         15.007112 +- 0.000626 seconds time elapsed  ( +-  0.00% )
Bogo ops/s measures consistently at slightly over 70,000 per run. It maintains a 3.59 IPC, L1d throughput of 2.96GB/s, and LLC throughput of 17KB/s.
Now, let’s re-run ‘flip’ with ‘read64’ concurrently executing on core 7 with a 21MB working set size:3perf stat -r 5 -d numactl –membind=1 stress-ng –vm 1 –taskset 7 –vm-keep –vm-bytes 21m –vm-method read64 –metrics-brief –timeout 15s
[mdawson@haswell ~]$ perf stat -r 5 -d numactl --membind=1 stress-ng --vm 1 --taskset 3 --vm-keep --vm-bytes 32k --vm-method flip --metrics-brief --timeout 15s
stress-ng: info:  [80393] dispatching hogs: 1 vm
stress-ng: info:  [80393] successful run completed in 15.00s
stress-ng: info:  [80393] stressor       bogo ops real time  usr time  sys time   bogo ops/s   bogo ops/s
stress-ng: info:  [80393]                           (secs)    (secs)    (secs)   (real time) (usr+sys time)
stress-ng: info:  [80393] vm              1028772     15.00     14.79      0.20     68583.61     68630.55
stress-ng: info:  [80416] dispatching hogs: 1 vm
stress-ng: info:  [80416] successful run completed in 15.00s
stress-ng: info:  [80416] stressor       bogo ops real time  usr time  sys time   bogo ops/s   bogo ops/s
stress-ng: info:  [80416]                           (secs)    (secs)    (secs)   (real time) (usr+sys time)
stress-ng: info:  [80416] vm              1028232     15.00     14.77      0.22     68547.73     68594.53
stress-ng: info:  [80441] dispatching hogs: 1 vm
stress-ng: info:  [80441] successful run completed in 15.00s
stress-ng: info:  [80441] stressor       bogo ops real time  usr time  sys time   bogo ops/s   bogo ops/s
stress-ng: info:  [80441]                           (secs)    (secs)    (secs)   (real time) (usr+sys time)
stress-ng: info:  [80441] vm              1026774     15.00     14.78      0.21     68450.44     68497.26
stress-ng: info:  [80462] dispatching hogs: 1 vm
stress-ng: info:  [80462] successful run completed in 15.00s
stress-ng: info:  [80462] stressor       bogo ops real time  usr time  sys time   bogo ops/s   bogo ops/s
stress-ng: info:  [80462]                           (secs)    (secs)    (secs)   (real time) (usr+sys time)
stress-ng: info:  [80462] vm              1018467     15.00     14.75      0.24     67896.67     67943.10
stress-ng: info:  [80484] dispatching hogs: 1 vm
stress-ng: info:  [80484] successful run completed in 15.00s
stress-ng: info:  [80484] stressor       bogo ops real time  usr time  sys time   bogo ops/s   bogo ops/s
stress-ng: info:  [80484]                           (secs)    (secs)    (secs)   (real time) (usr+sys time)
stress-ng: info:  [80484] vm              1020240     15.00     14.76      0.23     68014.82     68061.37

 Performance counter stats for 'numactl --membind=1 stress-ng --vm 1 --taskset 3 --vm-keep --vm-bytes 32k --vm-method flip --metrics-brief --timeout 15s' (5 runs):

         15,006.57 msec task-clock                #    1.000 CPUs utilized            ( +-  0.00% )
                15      context-switches          #    0.001 K/sec                    ( +-  2.60% )
                 0      cpu-migrations            #    0.000 K/sec
             1,704      page-faults               #    0.114 K/sec
    50,357,946,125      cycles                    #    3.356 GHz                      ( +-  0.04% )  (49.98%)
   176,607,210,201      instructions              #    3.51  insn per cycle           ( +-  0.20% )  (62.48%)
    17,122,614,281      branches                  # 1141.008 M/sec                    ( +-  0.20% )  (74.99%)
         2,241,031      branch-misses             #    0.01% of all branches          ( +-  0.96% )  (87.49%)
    43,313,418,811      L1-dcache-loads           # 2886.296 M/sec                    ( +-  0.22% )  (37.52%)
        59,635,656      L1-dcache-load-misses     #    0.14% of all L1-dcache hits    ( +-  0.80% )  (37.52%)
         1,894,194      LLC-loads                 #    0.126 M/sec                    ( +-  7.24% )  (37.50%)
         1,750,423      LLC-load-misses           #   92.41% of all LL-cache hits     ( +-  7.08% )  (37.48%)

         15.007929 +- 0.000884 seconds time elapsed  ( +-  0.01% )
With core 7 polluting the shared LLC, ‘flip’ drops from ~70,000 to ~68,000 bogo ops/s. Notice the drop in IPC from 3.59 to 3.51, L1d throughput drop from 2.96GB/s to 2.89GB/s, and LLC throughput increase from 17KB/s to 126KB/s. Despite a small, L1d-sized working set (32KB), messiness at the LLC level still adversely impacts core 3’s private core cache.
How does a non-inclusive LLC change matters, if at all?
Cascade Lake: Non-inclusive Last Level Cache
This Cascade Lake system contains 32KB of L1d cache and 25MB of LLC as depicted below:
[mdawson@cascadelake ~]$ lscpu
Architecture:        x86_64
CPU op-mode(s):      32-bit, 64-bit
Byte Order:          Little Endian
CPU(s):              16
On-line CPU(s) list: 0-15
Thread(s) per core:  1
Core(s) per socket:  8
Socket(s):           2
NUMA node(s):        2
Vendor ID:           GenuineIntel
CPU family:          6
Model:               85
Model name:          Intel(R) Xeon(R) Gold 6244 CPU @ 3.60GHz
Stepping:            7
CPU MHz:             4299.863
BogoMIPS:            7200.00
L1d cache:           32K
L1i cache:           32K
L2 cache:            1024K
L3 cache:            25344K
NUMA node0 CPU(s):   0,2,4,6,8,10,12,14
NUMA node1 CPU(s):   1,3,5,7,9,11,13,15
Just like in our previous Haswell demo, we’ll grab a baseline run of ‘flip’ on core 3 with a 32KB working set which fits our L1d cache:
[mdawson@cascadelake ~]$ perf stat -r 5 -d numactl --membind=1 stress-ng --vm 1 --taskset 3 --vm-keep --vm-bytes 32k --vm-method flip --metrics-brief --timeout 15s
stress-ng: info:  [389059] setting to a 15 second run per stressor
stress-ng: info:  [389059] dispatching hogs: 1 vm
stress-ng: info:  [389059] stressor       bogo ops real time  usr time  sys time   bogo ops/s     bogo ops/s
stress-ng: info:  [389059]                           (secs)    (secs)    (secs)   (real time) (usr+sys time)
stress-ng: info:  [389059] vm              1361427     15.00     14.62      0.31     90760.78       91187.34
stress-ng: info:  [389059] successful run completed in 15.00s
stress-ng: info:  [389064] setting to a 15 second run per stressor
stress-ng: info:  [389064] dispatching hogs: 1 vm
stress-ng: info:  [389064] stressor       bogo ops real time  usr time  sys time   bogo ops/s     bogo ops/s
stress-ng: info:  [389064]                           (secs)    (secs)    (secs)   (real time) (usr+sys time)
stress-ng: info:  [389064] vm              1361232     15.00     14.62      0.31     90747.84       91174.28
stress-ng: info:  [389064] successful run completed in 15.00s
stress-ng: info:  [389069] setting to a 15 second run per stressor
stress-ng: info:  [389069] dispatching hogs: 1 vm
stress-ng: info:  [389069] stressor       bogo ops real time  usr time  sys time   bogo ops/s     bogo ops/s
stress-ng: info:  [389069]                           (secs)    (secs)    (secs)   (real time) (usr+sys time)
stress-ng: info:  [389069] vm              1385590     15.00     14.61      0.32     92371.71       92805.76
stress-ng: info:  [389069] successful run completed in 15.00s
stress-ng: info:  [389077] setting to a 15 second run per stressor
stress-ng: info:  [389077] dispatching hogs: 1 vm
stress-ng: info:  [389077] stressor       bogo ops real time  usr time  sys time   bogo ops/s     bogo ops/s
stress-ng: info:  [389077]                           (secs)    (secs)    (secs)   (real time) (usr+sys time)
stress-ng: info:  [389077] vm              1361349     15.00     14.62      0.31     90755.72       91182.12
stress-ng: info:  [389077] successful run completed in 15.00s
stress-ng: info:  [389081] setting to a 15 second run per stressor
stress-ng: info:  [389081] dispatching hogs: 1 vm
stress-ng: info:  [389081] stressor       bogo ops real time  usr time  sys time   bogo ops/s     bogo ops/s
stress-ng: info:  [389081]                           (secs)    (secs)    (secs)   (real time) (usr+sys time)
stress-ng: info:  [389081] vm              1361366     15.00     14.62      0.31     90756.78       91183.26
stress-ng: info:  [389081] successful run completed in 15.00s

 Performance counter stats for 'numactl --membind=1 stress-ng --vm 1 --taskset 3 --vm-keep --vm-bytes 32k --vm-method flip --metrics-brief --timeout 15s' (5 runs):

         15,003.53 msec task-clock:u              #    1.000 CPUs utilized            ( +-  0.00% )
                 0      context-switches:u        #    0.000 /sec
                 0      cpu-migrations:u          #    0.000 /sec
               917      page-faults:u             #   61.118 /sec
    62,471,828,843      cycles:u                  #    4.164 GHz                      ( +-  0.01% )  (87.50%)
   252,455,743,745      instructions:u            #    4.04  insn per cycle           ( +-  0.15% )  (87.50%)
    28,372,743,612      branches:u                #    1.891 G/sec                    ( +-  0.08% )  (87.50%)
         2,840,043      branch-misses:u           #    0.01% of all branches          ( +-  1.82% )  (87.50%)
    62,138,602,359      L1-dcache-loads:u         #    4.142 G/sec                    ( +-  0.23% )  (87.50%)
       165,323,553      L1-dcache-load-misses:u   #    0.27% of all L1-dcache accesses  ( +-  1.64% )  (87.50%)
            22,070      LLC-loads:u               #    1.471 K/sec                    ( +-  0.18% )  (87.50%)
            15,785      LLC-load-misses:u         #   71.86% of all LL-cache accesses  ( +-  0.13% )  (87.50%)

         15.004840 +- 0.000385 seconds time elapsed  ( +-  0.00% )
In this case, bogo ops/s clocks in around 91,000 per run. It maintains a 4.04 IPC, L1d throughput of 4.14GB/s, and LLC throughput of ~1.5KB/s.
Now, let’s re-run ‘flip’ with ‘read64’ concurrently executing on core 7 with a 26MB working set size:4perf stat -r 5 -d numactl –membind=1 stress-ng –vm 1 –taskset 7 –vm-keep –vm-bytes 26m –vm-method read64 –metrics-brief –timeout 15s
[mdawson@cascadelake ~]$ perf stat -r 5 -d numactl --membind=1 stress-ng --vm 1 --taskset 3 --vm-keep --vm-bytes 32k --vm-method flip --metrics-brief --timeout 15s
stress-ng: info:  [388919] setting to a 15 second run per stressor
stress-ng: info:  [388919] dispatching hogs: 1 vm
stress-ng: info:  [388919] stressor       bogo ops real time  usr time  sys time   bogo ops/s     bogo ops/s
stress-ng: info:  [388919]                           (secs)    (secs)    (secs)   (real time) (usr+sys time)
stress-ng: info:  [388919] vm              1360767     15.00     14.61      0.32     90716.70       91143.13
stress-ng: info:  [388919] successful run completed in 15.00s
stress-ng: info:  [388928] setting to a 15 second run per stressor
stress-ng: info:  [388928] dispatching hogs: 1 vm
stress-ng: info:  [388928] stressor       bogo ops real time  usr time  sys time   bogo ops/s     bogo ops/s
stress-ng: info:  [388928]                           (secs)    (secs)    (secs)   (real time) (usr+sys time)
stress-ng: info:  [388928] vm              1385074     15.00     14.61      0.32     92337.25       92771.20
stress-ng: info:  [388928] successful run completed in 15.00s
stress-ng: info:  [388936] setting to a 15 second run per stressor
stress-ng: info:  [388936] dispatching hogs: 1 vm
stress-ng: info:  [388936] stressor       bogo ops real time  usr time  sys time   bogo ops/s     bogo ops/s
stress-ng: info:  [388936]                           (secs)    (secs)    (secs)   (real time) (usr+sys time)
stress-ng: info:  [388936] vm              1385027     15.00     14.60      0.32     92334.09       92830.23
stress-ng: info:  [388936] successful run completed in 15.00s
stress-ng: info:  [388944] setting to a 15 second run per stressor
stress-ng: info:  [388944] dispatching hogs: 1 vm
stress-ng: info:  [388944] stressor       bogo ops real time  usr time  sys time   bogo ops/s     bogo ops/s
stress-ng: info:  [388944]                           (secs)    (secs)    (secs)   (real time) (usr+sys time)
stress-ng: info:  [388944] vm              1361188     15.00     14.62      0.31     90744.86       91171.33
stress-ng: info:  [388944] successful run completed in 15.00s
stress-ng: info:  [388952] setting to a 15 second run per stressor
stress-ng: info:  [388952] dispatching hogs: 1 vm
stress-ng: info:  [388952] stressor       bogo ops real time  usr time  sys time   bogo ops/s     bogo ops/s
stress-ng: info:  [388952]                           (secs)    (secs)    (secs)   (real time) (usr+sys time)
stress-ng: info:  [388952] vm              1361205     15.00     14.61      0.32     90746.03       91172.47
stress-ng: info:  [388952] successful run completed in 15.00s

 Performance counter stats for 'numactl --membind=1 stress-ng --vm 1 --taskset 3 --vm-keep --vm-bytes 32k --vm-method flip --metrics-brief --timeout 15s' (5 runs):

         15,003.56 msec task-clock:u              #    1.000 CPUs utilized            ( +-  0.00% )
                 0      context-switches:u        #    0.000 /sec
                 0      cpu-migrations:u          #    0.000 /sec
               917      page-faults:u             #   61.118 /sec
    62,457,928,284      cycles:u                  #    4.163 GHz                      ( +-  0.02% )  (87.49%)
   252,469,328,307      instructions:u            #    4.04  insn per cycle           ( +-  0.17% )  (87.50%)
    28,369,514,296      branches:u                #    1.891 G/sec                    ( +-  0.09% )  (87.50%)
         2,889,046      branch-misses:u           #    0.01% of all branches          ( +-  0.69% )  (87.50%)
    62,125,500,337      L1-dcache-loads:u         #    4.141 G/sec                    ( +-  0.27% )  (87.50%)
       162,790,289      L1-dcache-load-misses:u   #    0.26% of all L1-dcache accesses  ( +-  2.14% )  (87.50%)
            22,027      LLC-loads:u               #    1.468 K/sec                    ( +-  0.13% )  (87.50%)
            15,768      LLC-load-misses:u         #   71.65% of all LL-cache accesses  ( +-  0.58% )  (87.50%)

        15.0046476 +- 0.0000781 seconds time elapsed  ( +-  0.00% )
Even though core 7 swamps the LLC with reads, the ‘flip’ workload throughput never drops, and IPC & L1d/LLC throughput rates remain the same between setups! Cascade Lake’s non-inclusive policy protected the performance of our low-latency application!
Be Inclusive Everywhere Except the LLC
We should strive for inclusivity in our personal and professional lives, and in society as a whole for the betterment of humanity. But when it comes to your CPU Last Level Cache, you might want to reconsider. And don’t forget to check your chosen cloud instance types. If they’re supported by anything earlier than Skylake, then you may just be suffering from a form of noisy neighbor you never anticipated.
- 1Paid affiliate link
- 2Lots of HFT firms are on Early Release Programs with chip manufacturers to test CPUs prior to GA release.
- 3perf stat -r 5 -d numactl –membind=1 stress-ng –vm 1 –taskset 7 –vm-keep –vm-bytes 21m –vm-method read64 –metrics-brief –timeout 15s
- 4perf stat -r 5 -d numactl –membind=1 stress-ng –vm 1 –taskset 7 –vm-keep –vm-bytes 26m –vm-method read64 –metrics-brief –timeout 15s
