
Estimated reading time: 11 minutes
The late Kimbo Slice gained initial fame beating up rival tough guys in backyard brawls in the early aughts. Current UFC star Jorge Masvidal’s career launched in a similar fashion. Millions have enjoyed watching their street fight videos over the past two decades. Despite the excitement those bouts offered us spectators, such unsanctioned fights pose significant risks to the fighters. No pre-fight health checks. No drug testing. Untrained referees (if there’s a referee at all). Size/weight mismatches. No on-site medical personnel. On the other hand, sanctioned matches ensure the availability of the aforementioned safety features and more for athletes. Obviously, the risk of physical harm remains high whether a fight is sanctioned or not. But sanctioning mitigates those risks far better than any “off the books” event ever could.

Likewise, cache ping-pong is a dangerous game for multithreaded applications. Decades of research detail its harmful effect on application performance. While it’s obviously better just to remove all cache contention, a developer conceivably might sanction some amount of it as a necessity for the chosen algorithm. She might even offer features or configuration options to dampen its effects. But when a platform introduces unsanctioned cache ping-pong into the mix, it can spawn surprising performance gotchas. Today, we’ll demo a tool that exhibits both the sanctioned and unsanctioned types, and then look at what’s available to crack down on unsanctioned cache ping-pong games.
NOTE: Demos shown in this article were performed on an Intel i9-10940X CPU running on CentOS 7.8.2003 (3.10.0-1127.19.1.el7)
Table of contents
What is Cache Ping-Pong?
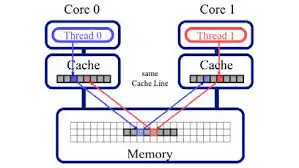
Cache ping-pong is an effect that occurs when a cache line (usually 64 bytes in size) continuously swaps between the caches of multiple CPU cores. It is an artifact of MESI-based coherency protocols and the necessary inter-cache communication that must occur to effect the various state transitions. “False sharing”, where multiple cores inadvertently access the same cache line despite referencing distinct data items due to unfortunate layout proximity, is probably the most commonly discussed form of cache ping-pong. However, cache ping-ponging includes “True sharing”, as well, where multiple cores purposely reference the exact same data item. Whether true or false sharing, the adverse latency and throughput effects of the resulting cache ping-ponging remain the same.
A Very Familiar Case Study
I can’t think of a benchmark that has served as the “whipping boy” of cache contention research more than Phoenix Benchmark Suite’s linear_regression. Nearly a dozen papers written about false sharing detection include this benchmark as a Case Study. Seriously! Right now, Google “linear_regression AND false sharing” and skim through the many research papers and blog articles that come up.
In the interest of not beating a dead horse, then, I’ll only give you the broad strokes of its issue:
 50 typedef struct
 51 {
 52     pthread_t tid;
 53     POINT_T *points;
 54     int num_elems;
 55     long long SX;
 56     long long SY;
 57     long long SXX;
 58     long long SYY;
 59     long long SXY;
 60 } lreg_args;
Upon startup, linear_regression declares a 64-byte struct (lreg_args), detects the core count, allocates an array of lreg_args structs sized to that core count, and finally spawns threads on each core. Each thread executes linear_regression_pthread() on a distinct element of the array. Since lreg_args is the size of a cache line, then no thread should interfere with another. And yet, this desired workload separation among the threads fails to occur. But why?
 66 void *linear_regression_pthread(void *args_in)
 67 {
 68    lreg_args* args =(lreg_args*)args_in;
 69    int i;
 70
 71    args->SX = 0;
 72    args->SXX = 0;
 73    args->SY  = 0;
 74    args->SYY = 0;
 75    args->SXY = 0;
 76
 77     // ADD UP RESULTS
 78    for (i = 0; i < args->num_elems; i++)
 79    {
 80       //Compute SX, SY, SYY, SXX, SXY
 81       args->SX  += args->points[i].x;
 82       args->SXX += args->points[i].x*args->points[i].x;
 83       args->SY  += args->points[i].y;
 84       args->SYY += args->points[i].y*args->points[i].y;
 85       args->SXY += args->points[i].x*args->points[i].y;
 86    }
 87
 88    return (void *)0;
 89 }
You can probably guess from the setup (and the name of this article) that it’s the result of cache ping-ponging. Interestingly, though, this benchmark suffers from both “sanctioned” and “unsanctioned” cache contention. Let’s first examine the former.
Sanctioned Cache Ping-Pong
The most widely discussed root cause of this benchmark’s cache ping-pong problem is how the array (tid_args) of lreg_args structs is allocated:
tid_args = (lreg_args *)CALLOC(sizeof(lreg_args), num_procs);Function CALLOC is defined in a header file like so:
 50 inline void * CALLOC(size_t num, size_t size)
 51 {
 52    void * temp = calloc(num, size);
 53    assert(temp);
 54    return temp;
 55 }
Therein lies the problem: calloc does not guarantee 64-byte alignment. So, while the lreg_args struct is 64-bytes in size, it may straddle two cache lines due to the alignment of the tid_args array which houses it. Thus, the ostensibly independent threads create cache ping-pong traffic from inadvertently reading/modifying a neighboring thread’s cache line – i.e., “false sharing.”
But here’s the kicker: EVERYONE KNOWS ABOUT THIS! Every blog post and research article of *at least* the past decade have pinpointed this issue (e.g., here, here, and here). Yet, that portion of the code remains the same despite other code changes in that interim (yet another reason not to blindly trust benchmark software). Such incidents, where the root cause directly points to decisions around coding and design, represent “sanctioned cache ping-ponging.” While I can’t think of a good reason for leaving the “false sharing” variant unaddressed, dev teams may have sound design reasons for leaving “true sharing” variants intact. Developers may even offer configuration options to help end-users alleviate the adverse cache contention effects, much like a sanctioning body offers various safety measures for approved boxing matches.
But what about “unsanctioned cache ping-pong”? Incidents for which the root cause does NOT point to specific lines of application code?
Unsanctioned Cache Ping-Pong
My favorite tool for diagnosing cache ping-pong issues is the freely available perf c2c utility (you can find a fantastic writeup on this tool here). It tracks frequent HITM events – i.e., events where a core requests Read access to a cache line and finds that line in the Modified state in another core’s cache. Since this tool works by sampling, I had to restrict the linear_regression benchmark to only 2 threads so that it would run long enough to get enough samples. This resulted in a ~1.5 second runtime (still kinda quick, unfortunately).
Here’s a snippet of the output from running linear_regression under perf c2c:
[mdawson@eltoro]$ perf c2c record -F 3999 ./lreg-pthread linear_regression_datafiles/key_file_500MB.txt

[mdawson@eltoro]$ perf c2c report -NN -c tid,iaddr --stdio

=================================================
            Trace Event Information
=================================================
  Total records                     :      18703
  Locked Load/Store Operations      :         97
  Load Operations                   :       8689
  Loads - uncacheable               :          0
  Loads - IO                        :          0
  Loads - Miss                      :          0
  Loads - no mapping                :          0
  Load Fill Buffer Hit              :       3370
  Load L1D hit                      :       5239
  Load L2D hit                      :          7
  Load LLC hit                      :         53
  Load Local HITM                   :         39
  Load Remote HITM                  :          0
  Load Remote HIT                   :          0
  Load Local DRAM                   :         20
  Load Remote DRAM                  :          0
  Load MESI State Exclusive         :          0
  Load MESI State Shared            :         20
  Load LLC Misses                   :         20
  LLC Misses to Local DRAM          :      100.0%
  LLC Misses to Remote DRAM         :        0.0%
  LLC Misses to Remote cache (HIT)  :        0.0%
  LLC Misses to Remote cache (HITM) :        0.0%
  Store Operations                  :      10014
  Store - uncacheable               :          0
  Store - no mapping                :          0
  Store L1D Hit                     :       9647
  Store L1D Miss                    :        367
  No Page Map Rejects               :        609
  Unable to parse data source       :          0

=================================================
    Global Shared Cache Line Event Information
=================================================
  Total Shared Cache Lines          :          4
  Load HITs on shared lines         :       6780
  Fill Buffer Hits on shared lines  :       3165
  L1D hits on shared lines          :       3575
  L2D hits on shared lines          :          0
  LLC hits on shared lines          :         40
  Locked Access on shared lines     :          0
  Store HITs on shared lines        :       7316
  Store L1D hits on shared lines    :       6950
  Total Merged records              :       7355

  =================================================
      Shared Cache Line Distribution Pareto
=================================================
#
#        ----- HITM -----  -- Store Refs --  --------- Data address ---------                                            ---------- cycles ----------    Total       cpu                                       Shared
#   Num      Rmt      Lcl   L1 Hit  L1 Miss              Offset  Node  PA cnt                   Tid        Code address  rmt hitm  lcl hitm      load  records       cnt                         Symbol        Object                     Source:Line  Node{cpu list}
# .....  .......  .......  .......  .......  ..................  ....  ......  ....................  ..................  ........  ........  ........  .......  ........  .............................  ............  ..............................  ....
#
  -------------------------------------------------------------
      0        0       32     2089      233            0x847000
  -------------------------------------------------------------
           0.00%   87.50%    0.00%    0.00%                0x18     0       1    62185:lreg-pthread            0x401146         0       263       210      331         1  [.] linear_regression_pthread  lreg-pthread  linear_regression_pthread.c:81   0{0}
           0.00%   12.50%    0.00%    0.00%                0x20     0       1    62185:lreg-pthread            0x401129         0       233       221      395         1  [.] linear_regression_pthread  lreg-pthread  linear_regression_pthread.c:78   0{0}
           0.00%    0.00%   55.00%   99.14%                0x28     0       1    62185:lreg-pthread            0x401155         0         0         0     1380         1  [.] linear_regression_pthread  lreg-pthread  linear_regression_pthread.c:81   0{0}
           0.00%    0.00%   15.61%    0.43%                0x30     0       1    62185:lreg-pthread            0x401171         0         0         0      327         1  [.] linear_regression_pthread  lreg-pthread  linear_regression_pthread.c:83   0{0}
           0.00%    0.00%   29.39%    0.43%                0x38     0       1    62185:lreg-pthread            0x401165         0         0         0      615         1  [.] linear_regression_pthread  lreg-pthread  linear_regression_pthread.c:82   0{0}

  -------------------------------------------------------------
      1        0        4        0        0  0xffff9e6cc3b9d780
  -------------------------------------------------------------
           0.00%  100.00%    0.00%    0.00%                0x10     0       1    62185:lreg-pthread  0xffffffffbd5f8f16         0       239         0        4         1  [k] find_vma  [kernel.vmlinux]  mmap.c:2257   0{0}

  -------------------------------------------------------------
      2        0        2     4860      133            0x847040
  -------------------------------------------------------------
           0.00%  100.00%    0.00%    0.00%                 0x0     0       1    62185:lreg-pthread            0x40113e         0       246       136      626         1  [.] linear_regression_pthread  lreg-pthread  linear_regression_pthread.c:78   0{0}
           0.00%    0.00%   14.20%   35.34%                 0x0     0       1    62185:lreg-pthread            0x401181         0         0         0      737         1  [.] linear_regression_pthread  lreg-pthread  linear_regression_pthread.c:84   0{0}
           0.00%    0.00%   47.28%    1.50%                 0x8     0       1    62185:lreg-pthread            0x4011a3         0         0         0     2300         1  [.] linear_regression_pthread  lreg-pthread  linear_regression_pthread.c:85   0{0}
           0.00%    0.00%   30.16%   55.64%                0x28     0       1    62186:lreg-pthread            0x401155         0         0         0     1540         1  [.] linear_regression_pthread  lreg-pthread  linear_regression_pthread.c:81   0{1}
           0.00%    0.00%    4.30%    1.50%                0x30     0       1    62186:lreg-pthread            0x401171         0         0         0      211         1  [.] linear_regression_pthread  lreg-pthread  linear_regression_pthread.c:83   0{1}
           0.00%    0.00%    4.05%    6.02%                0x38     0       1    62186:lreg-pthread            0x401165         0         0         0      205         1  [.] linear_regression_pthread  lreg-pthread  linear_regression_pthread.c:82   0{1}
At the top, you’ll notice a summary of cache event activity tracked during profiling. But under the “Shared Cache Line Distribution Pareto” section, you’ll see a numbered list of entries highlighting cache lines manifesting contention. It even presents a breakdown of involved threads, cores, and source code line locations. Due to the short benchmark runtime and perf c2c sampling, you’ll notice some missing entries in the output. For example, Entries 0 and 1 under this section fail to list the involvement of thread 1 on core 1.
Entries 0 and 2 both point to sources of the sanctioned cache ping-pong we described in the previous section. All source code lines identified (lines 78 – 85) belong to the linear_regression_pthread() function previously highlighted.
However, note the source code line pinpointed at Entry 1. It doesn’t point to anything in the linear_regression benchmark source code at all. It points to. . . the kernel???
NOTE: For an in-depth discussion on using perf for profiling and reading hardware PMU counters for application performance analysis, check out our book Performance Analysis and Tuning on Modern CPUs.1Paid affiliate link
Unsanctioned Cache Ping-Pong Source #1
Specifically, Entry 1 points to a cache line referenced on line 2257 of the mmap.c kernel source file inside the find_vma() function:
2250 /* Look up the first VMA which satisfies  addr < vm_end,  NULL if none. */
2251 struct vm_area_struct *find_vma(struct mm_struct *mm, unsigned long addr)
2252 {
2253         struct vm_area_struct *vma = NULL;
2254
2255         /* Check the cache first. */
2256         /* (Cache hit rate is typically around 35%.) */
2257         vma = ACCESS_ONCE(mm->mmap_cache);    <----- a READ here
2258         if (!(vma && vma->vm_end > addr && vma->vm_start <= addr)) {
2259                 struct rb_node *rb_node;
2260
2261                 rb_node = mm->mm_rb.rb_node;
2262                 vma = NULL;
2263
2264                 while (rb_node) {
2265                         struct vm_area_struct *vma_tmp;
2266
2267                         vma_tmp = rb_entry(rb_node,
2268                                            struct vm_area_struct, vm_rb);
2269
2270                         if (vma_tmp->vm_end > addr) {
2271                                 vma = vma_tmp;
2272                                 if (vma_tmp->vm_start <= addr)
2273                                         break;
2274                                 rb_node = rb_node->rb_left;
2275                         } else
2276                                 rb_node = rb_node->rb_right;
2277                 }
2278                 if (vma)
2279                         mm->mmap_cache = vma;   <----- a WRITE here
2280         }
2281         return vma;
2282 }
So it looks like we have some “True sharing” going on at the kernel level at “mm->mmap_cache”, which is global to the entire process and all constituent threads. When this “mmap_cache” is effective, it obviates the need to walk the red-black tree (starting at line 2258) to find the desired VMA area. The hit-rate on the per-process “mmap_cache” is pretty good for single-threaded processes. But results can vary widely for multithreaded ones, especially if using thread-aware, arena-based memory allocators where there can be little to no overlap in VM areas among threads.
The next question, then, is: What causes these find_vma() calls in the linear_regression benchmark? Let’s do a kernel function stack trace and see:
[mdawson@eltoro]$ sudo trace-cmd record -p function -l find_vma --func-stack ./lreg-pthread linear_regression_datafiles/key_file_500M

[mdawson@eltoro]$ sudo trace-cmd report

           <...>-75060 [001] 27657116.864262: function:             find_vma
           <...>-75060 [001] 27657116.864266: kernel_stack:         <stack trace>
=> do_page_fault (ffffffffbdb8d975)
=> page_fault (ffffffffbdb89778)
<repeating>
BOOM! Page faults! Regular ole, cost-of-doing-business page faults are causing this unsanctioned cache ping-ponging! Let’s look now at do_page_fault() and see what else we discover.
Unsanctioned Cache Ping-Pong Source #2
1362 do_page_fault(struct pt_regs *regs, unsigned long error_code)
1363 {
1364         enum ctx_state prev_state;
1365         /* Get the faulting address: */
1366         unsigned long address = read_cr2();
1367
1368         prev_state = exception_enter();
1369         __do_page_fault(regs, error_code, address);
1370         exception_exit(prev_state);
1371 }
So, do_page_fault() calls __do_page_fault():
1142 __do_page_fault(struct pt_regs *regs, unsigned long error_code,
1143                 unsigned long address)
1144 {
1145         struct vm_area_struct *vma;
1146         struct task_struct *tsk;
1147         struct mm_struct *mm;
1148         int fault, major = 0;
1149         unsigned int flags = FAULT_FLAG_ALLOW_RETRY | FAULT_FLAG_KILLABLE;
1150
1151         tsk = current;
1152         mm = tsk->mm;
1153
1154         /*
1155          * Detect and handle instructions that would cause a page fault for
1156          * both a tracked kernel page and a userspace page.
1157          */
1158         if (kmemcheck_active(regs))
1159                 kmemcheck_hide(regs);
1160         prefetchw(&mm->mmap_sem);
Well look what we have here! We’re accessing another data item that’s globally available to the entire process and all constituent threads – “mm->mmap_sem”. With prefetchw, the kernel hints to the CPU to prefetch the cache line containing “mm->mmap_sem” and invalidate all copies of it from other core caches in preparation for modification. Why does the kernel do this? Because “mm->mmap_sem” is a r/w semaphore that controls access to the process address space but allows concurrent readers for things like page faults. If we look further down in the __do_page_fault() we’ll notice where the kernel actually updates this semaphore to signal a new reader:
1266         if (unlikely(!down_read_trylock(&mm->mmap_sem))) {
1267                 if (!(error_code & X86_PF_USER) &&
1268                     !search_exception_tables(regs->ip)) {
1269                         bad_area_nosemaphore(regs, error_code, address, NULL);
1270                         return;
1271                 }
1272 retry:
1273                 down_read(&mm->mmap_sem);
1274         } else {
1275                 /*
1276                  * The above down_read_trylock() might have succeeded in
1277                  * which case we'll have missed the might_sleep() from
1278                  * down_read():
1279                  */
1280                 might_sleep();
1281         }
1282
1283         vma = find_vma(mm, address);  <--- here's where this journey all started
So, multiple threads which page fault concurrently against the shared address space will contend for write access to “mm->mmap_sem” (i.e. true sharing), causing cache ping-ponging. Our run of perf c2c failed to pick up samples involving cache contention on “mm->mmap_sem” (benchmark run is too quick), but we were able to find it, nonetheless.
Cracking Down on Unsanctioned Cache Ping-Pong
What can we do about these 2 cases of unsanctioned cache ping-pong? It’s not directly the fault of any code we’ve written, unlike in the linear_regression “false sharing” case. Does this mean we have no recourse?
Of course, I always advise pre-faulting pages in low latency applications to prevent runtime hiccups. But that’s not always feasible – e.g., in the case of closed source applications you’re tasked with tuning.
But don’t fret! There’s one solution available today, and there are fixes coming soon that should help tremendously in the near future. Let’s break it down by root cause.
Addressing Root Cause #1
Recall that the first source of unsanctioned cache ping-ponging involved r/w access to “mm->mmap_cache.” The issue here is that all threads of a process share access to the mm_struct, causing “true sharing” for multithreaded applications that page fault at runtime. But what if that VMA cache migrated from a per-address space resource to a per-thread one? That would eliminate this source of “true sharing” in find_vma() since each thread would only update its own VMA cache..
That is exactly what Davidlohr Bueso’s VMA-caching kernel patch set does! It moves the cache up from the mm_struct level to the task_struct level, and increases the cache from a single entry to an array of four entries. The remarkable cache hit rates achieved on the multithreaded “ebizzy” benchmark provide a glimpse of its performance benefits.
From what I can tell, this kernel update has been available since the 3.12 kernel release. But, as this demo clearly shows, it wasn’t backported into my desktop version of CentOS 7.8 2003. I don’t have a CentOS 8 installation but I’d be surprised if the patch set is unavailable in that version.
CRACKDOWN #1: Run a more recent Linux distribution/kernel.
Addressing Root Cause #2
Recall that the second source of unsanctioned cache ping-ponging involved r/w access to “mm->mmap_sem.” Google the term “mmap_sem” and you’ll see the loooong history of Linux kernel developers anguishing over strategies to reduce its impact. Relatively recently, a patch set called “Speculative Page Faults” has emerged that appears to be making lots of progress. With this update, page faults progress without grabbing “mmap_sem”. Only in the event that the kernel notices an “mmap_sem” writer (page faults are readers) has made a change during its processing will it revert its speculative operations and retry in the old, semaphore grabbin’ way.
It’s not available just yet, but it looks like it will be merged soon based on the email correspondence activity.
CRACKDOWN #2: Keep an eye out for a 5.x kernel release with Speculative Page Faults included.
Keep Those Games Sanctioned
Nothing can eliminate the inherent danger in combat sports. And when competitive combat events occur “off the books”, the risk potential increases tremendously. But under the auspices and watchful eye of a sanctioning body, health risks are mitigated and athlete safety is improved. Likewise, a developer who is aware of the sources of cache ping-pong in his code can account for it and provide options and features to dampen its effects in the event that elimination is infeasible. But unsanctioned cache ping-pong games often fly under the radar and bite end users when they least suspect it.
Keep a watchful eye on cache ping-ponging in your multithreaded applications by regularly profiling with tools that offer cache contention alerting. Tools like perf c2c, toplev.py, and Intel VTune Profiler help immensely.2Both toplev.py and Intel VTune Profiler will expose cache line contention as “Contested Accesses.” Lastly, don’t always restrict your profiling sessions to userland-only sampling. Doing so in this demo would’ve blinded us completely to the kernel-level source of unsanctioned cache ping-pong.
Happy profiling!
- 1Paid affiliate link
- 2Both toplev.py and Intel VTune Profiler will expose cache line contention as “Contested Accesses.”
